reading

Momentum, Value, and Short-Term Movement in the Stock Market

TraderFeed: Momentum, Value, and Short-Term Movement in the Stock Market

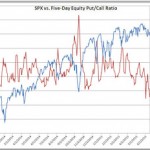
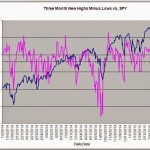
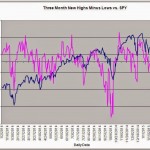
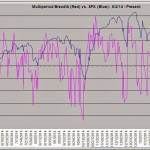
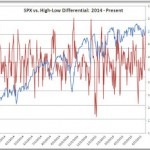
Momentum, Value, and Short-Term Movement in the Stock MarketAbove is a plot of an interesting measure that tracks the difference between short term and intermediate term new highs minus new lows for SPX stocks only. (Raw data from the Index Indicators site). When that difference is highly positive, it means that […]

TraderFeed: A Quick Look at Sentiment in the Stock Market

I find it interesting–and surprising–that the five-day equity put/call ratio is hovering at its lowest level since the start of 2014. Amidst concerns about rate hikes and Greece, traders of individual stocks don’t seem particularly bearish on their names. Breadth also continues mixed, as we had 594 stocks across all exchanges make fresh monthly highs and 530 register new monthly […]

TraderFeed: Are We Significantly Oversold In The Stock Market?

Above is a useful short-term measure of whether we are trading in an “overbought” versus “oversold” mode in the U.S. stock market. The blue line is the cash SPX; the red line is a five-day moving average of the following:(5-day new highs minus 5-day new lows) + (20-day new highs minus 20-day new lows) + (100-day new highs minus 100-day […]

TraderFeed: Where is Weakness Coming From in the Stock Market?

TraderFeed: Where is Weakness Coming From in the Stock Market?

Where is Weakness Coming From in the Stock Market?It’s interesting to note that, according to the excellent screening tools at FinViz, the three U.S. stock market sectors that have been down over the prior two quarters have been Conglomerates, Basic Materials, and Utilities (top chart). Those are also the highest yielding […]

TraderFeed: Three Views of the Breadth of Stock Market Strength

Here are updated charts for what we might call the breadth of market strength and weakness. (Raw data from the excellent Stock Charts site.) Any individual stock can give a buy or sell signal according to rules from a technical trading system. The top chart reflects Wilder’s Parabolic Stop-and-Reverse (SAR) system; the middle chart tracks a system based on Bollinger […]

TraderFeed: New Highs and Lows in the Stock Market and What …

TraderFeed: New Highs and Lows in the Stock Market and What They Tell Us

New Highs and Lows in the Stock Market and What They Tell UsIf you’ve followed the blog for a while, you know that tracking the number of stocks across all exchanges making fresh one- and three-month new highs versus lows is one of my favorite measures of […]

Understanding Options-Based Sentiment in the Stock Market

I’m currently working on creating better indicators of stock market sentiment. Above is a five-day moving average of the equity put/call ratio: the ratio of put volume traded for all listed individual stocks divided by their call volume (no index volume included; raw data from e-Signal). You can see that spikes in the ratio have corresponded pretty well with buying […]

TraderFeed: Assessing the Recent Stock Market Strength

Stocks moved smartly to new highs in the major averages this past week. Sector rotation was particularly noteworthy, with former leaders utilities and consumer staples–defensive and yield plays–falling behind and more growth-oriented sectors–consumer discretionary and raw materials–showing particular strength. This reflects strength in U.S. economic data and an increased pricing of odds that the Fed will begin to normalize interest […]

TraderFeed: Several Views of Stock Market Breadth

Recent market behavior in stocks has been confusing for traders, as we’ve had a good deal of volatility during 2015, with little ultimate directional movement. VIX has stubbornly stayed above 15 for much of this time, a notable change from most of 2014. Here are three views of breadth in the U.S. stock market that can help us make sense […]

TraderFeed: A Fresh Look at Stock Market Sentiment

I recently took a look at changes in the number of shares outstanding of the SPY ETF as a sentiment measure. When traders are bullish, shares are created in the ETF; when they are bearish, shares are redeemed. This is a useful sentiment gauge, because it reflects what traders are actually doing in the market, not just their stated sentiment.What […]