rsi

EUR/USD eyes further upside pressure – technical analysis | Forex …

EUR/USD eyes further upside pressure – technical analysisEUR/USD Daily, Forex News | Written By Guest |

Created: Feb 23, 2014 16:35 GMT

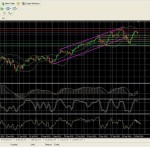
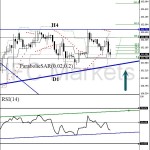
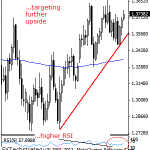
EURUSD: With EUR maintaining its bullish bias, further gain is envisaged in the new week. Resistance resides at the 1.3800 level where a violation will turn attention to the 1.3850 level and then the 1.3900 level, its psycho level. Its […]

DAX- Technical Analysis – FX-Insights

The DAX index has clearly broken out of its upward channel (purple lines) on a daily time frame. However, after a little correction we can see that the price has bounced back up from the 61.8% retracement level of Fibonacci. This is an important signal because this represents the strength for the overall bull trend.The RSI has turned lower near […]

USD/JPY bulls may soon take the initiative – technical analysis …

USD/JPY bulls may soon take the initiative – technical analysisForex News | Written By Dimitry Loukashov |
Created: Feb 20, 2014 13:47 GMT
Today there are two indicators of the U.S. economy – the core CPI for this month and initial jobless claims for the previous week (Unemployment Claims) coming out at once.The CPI is longer-term indicator and therefore it is more […]

USD/JPY- Technical Analysis – FX-Insights

The USD/JPY is trading above its upward trend line on a 60 minute time frame.  The pair is trading above the 100day (shown in yellow) moving average and the 50day (shown in green), which means that the bulls are in control of the price. The ADX indicator is not giving any clear signal at the moment, however, we do have […]

Apple – After disappointing earning, What technical analysis is …

Apple is trading in an upward wedge pattern on a 4 hour time frame. If the price breaks out of this pattern to the downside, there is usually a big move to the downside. Within this pattern, we also have the symmetrical triangle pattern formed and the downward projection of this, could push the price towards the support area which […]

AUD/USD- Technical Analysis – FX-Insights

The AUD/USD pair has broken a major reversal pattern- Head & Shoulder on a daily time frame. The price is trading below the 50 day (shown in green) and 100 day (shown in yellow) moving average which means that the bears are in strong control of the price.  The pair has pierced the Bollinger band at this level which means that the […]