Technical Analysis, September 1st — September 5th
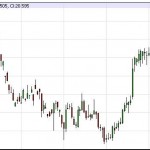
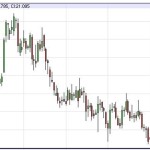
The technical analysis, that includes the indicators’ data and major pivot points for Brent Oil, Gold, Silver and Copper as traded on spot market as of August 30th, 2014:Crude OilIndicatorsMoving Averages
RSI
Parabolic SAR
CCI
Short
Neutral
Long
Neutral
Floor pivot points3rd Sup
2nd Sup
1st Sup
Pivot
1st Res
2nd Res
3rd Res
90.99
92.02
93.93
94.96
96.87
97.90
99.81
Woodie’s pivot points2nd Sup
1st Sup
Pivot
1st Res
2nd Res
92.24
94.38
95.18
97.32
98.12
Camarilla pivot points4th Sup
3rd Sup
2nd Sup
1st Sup
1st Res
2nd Res
3rd Res
4th Res
94.23
95.04
95.31
95.58
96.12
96.39
96.66
97.47
Fibonacci retracement levels0.0%
23.6%
38.2%
50.0%
61.8%
100.0%
93.04
93.73
94.16
94.51
94.86
95.98
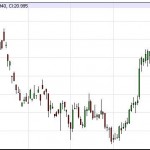
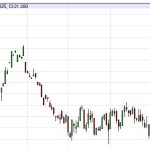
GoldIndicatorsMoving Averages
RSI
Parabolic SAR
CCI
Short
Neutral
Short
Neutral
Floor […]