
The Best Forex Strategy Based on Technical Analysis – Udemy

Forex trading can be a great way to increase your investment capital and provide a nest egg for your future, but selecting a trading strategy that suits you can be complicated. Swing trading versus day trading, market sentiment versus technical analysis, and the plethora of different indicators available and the strategies based on these indicators, make choosing the right strategy for you very difficult. If you are new to trading and are looking for a trading system that may suit you, then take a look at the Comprehensive Forex Mastery Program available from Udemy. This course is suitable for both beginners and seasoned traders and offers over 90 lectures and 10 hours of content that will take your trading skills to a new level of success.
Technical analysis relies on indicators to help you make trading decisions to buy and sell. There are a number of different indicators available to help you make trading decisions. Most of the online trading companies include the common trading indicators in their trading applications. The trick is to figure out which indicators are best for your trading style and purposes. Different indicators are best suited to different types of markets.
Choose an Indicator that Suits Your Market
Different indicators suit different markets. Certain indicators are best for ranging markets, other indicators suit flat markets, and others suit trending markets. It is important to choose the right types of indicators for the right types of markets. To select the right indicator for your market, you need to know what indicators are available to begin with.
Here are some of the most common indicators that are used for Forex trading:
· Moving averages
· Bollinger Bands
· Candlestick formations
Forex Strategies Based on the Moving Averages Indicator
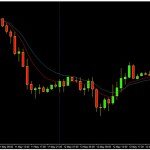
One of the most popular trading strategies is based on the technical indicator called moving averages. Moving averages are calculated by taking the price of currency and calculating the average price over different periods. Traders use a number of moving averages on a chart to gauge the trend in the market and to make buy and sell decisions based on where these moving averages cross over one another.
Moving averages are often used in conjunction with other indicators to confirm trends and to ensure profitable trades. The following image shows the EURUSD Forex Pair with two moving averages on the chart. Where the moving averages cross indicate a buy or sell signal and the moving averages also represent a trending market.
The Forex basics course includes 26 lectures and 3.5 hours of content that will introduce you to the basic indicators available in the Forex trading market.
Forex Strategies Based on Bollinger Bands
The Bollinger Bands is a technical indicator that was developed by John Bollinger in the 1980’s. This indicator is often used by traders to decide when to buy or sell Forex. Bollinger bands are used to filter price action to gather information about the current trend of an instrument within the market. Bollinger bands are created using an exponential moving average and then creating upper and lower price channels above and below the center line.
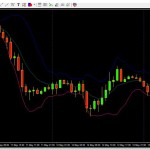
This is what a Bollinger band looks like on a chart:
The light blue line represents the center line. The dark blue line is the upper Bollinger Band and the lower purple line represents the lower Bollinger Band.
Strategies that are based on the Bollinger bands generally include strategies that observe the bands for an indication of volatile price action in the currency pair. Where the bands contract, it indicates decreased volatility and where the bands expand it indicates increased market volatility.
When an instrument constantly crosses the lower band, the bands indicate that that instrument is oversold and it is most likely to exit a trade or it may indicate a good buy signal. Where the instrument consistently breaks the upper Bollinger Band, it indicates that the currency is overbought and it can be used as a signal to exit the trade or that it is time to sell the pair.
The Forex Foundation Course will show you how to work with price action and price action channels to create your own profitable Forex trading strategy.
Forex Strategies Based on Candlestick Formations
Candlesticks were developed by the Japanese in the seventeenth century to help them with their rice trading. They developed a way of visually representing the price action of an instrument to represent what had happened during that period. Each candlestick represents the high, low, and closing price of the instrument for that period of trading.
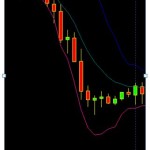
A candlestick is formed by representing these elements in a bar formation. This is what candlesticks looks like on a chart:
Each candlestick has a body and two tails, one above the body and one below the body. The color of the candlestick represents whether the price closed above or below the opening price.
Traders use candlesticks and specific candlestick patterns to gain information about the market sentiment of a pair to decide if the pair should be bought or sold.
A hanging man for example is generally a candle with a long tail and a short body that follows a candle in an upward trend. A hanging man indicates that it is time to get out of a trade or time to sell the instrument. The candle outlined below is an example of a hanging man candle and is an indicator used by traders to sell the instrument:
The Complete Trading System course will teach you how to read candlestick language and how to take advantage of different candlestick patterns in your trades.
Indicator Combinations in Forex Trading
Most traders rely on two or more indicators to confirm their trades. To create the best Forex strategy for you, you should choose indicators that you understand so that you can apply the principals of these indicators in your trading strategy.
The Complete Forex Trader course will introduce you to various indicators including the ADX, Bollinger Bands, Moving Averages, MACD and RSI.
Original link:
The Best Forex Strategy Based on Technical Analysis – Udemy
See which stocks are being affected by Social Media

