
The Stock Market 2015: A Sector By Sector Valuation Perspective …
Summary
There are many types of risk associated with investing.
Some risks are obvious and straightforward while other risks are far less obvious.
One of the most obvious risks is valuation risk.
As we enter 2015 with a blended P/E ratio of 17, the S&P 500’s valuation sits at the upper end of its historical normal valuation range since 2001.
Current S&P 500 valuation suggests that the double-digit returns we have recently become accustomed to with the index may be coming to an end.
Introduction
For the most part, most of my recent work has been directed to the retired investor or to those investors nearing retirement or planning for future retirement. Although financial assets are important to every investor, to the retired investor they literally become sacred. As a result, risk becomes a more serious consideration. There are many types of risk associated with investing, some are obvious and straightforward while other risks are far less obvious, and therefore, more difficult to assess. Consequently, I believe it is important to recognize and assess those risks that can be logically evaluated and recognized.
One of the most obvious risks is valuation risk. Sound valuation can be determined through simple mathematical calculations, and when viewed properly, numbers don’t lie. However, investors of all kinds are people, and therefore, we all possess the emotional response. But as many experts have taught, emotions such as hope are not investment strategies. A sound investment strategy is built upon critical analysis and a realistic assessment of facts. Sound investing principles are timeless, and therefore, regarding sound investing strategies, it is never different this time.
With this article, I will examine the current fundamental value of the S&P 500 and discuss the implication it presents for 2015 returns. Although forecasting future returns can never be done with perfect precision, estimating a reasonable range of probabilities is possible. In my opinion, one of the best places to start is with a reasoned evaluation of fair value.
The Market Past, Present and Future
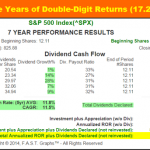
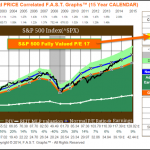
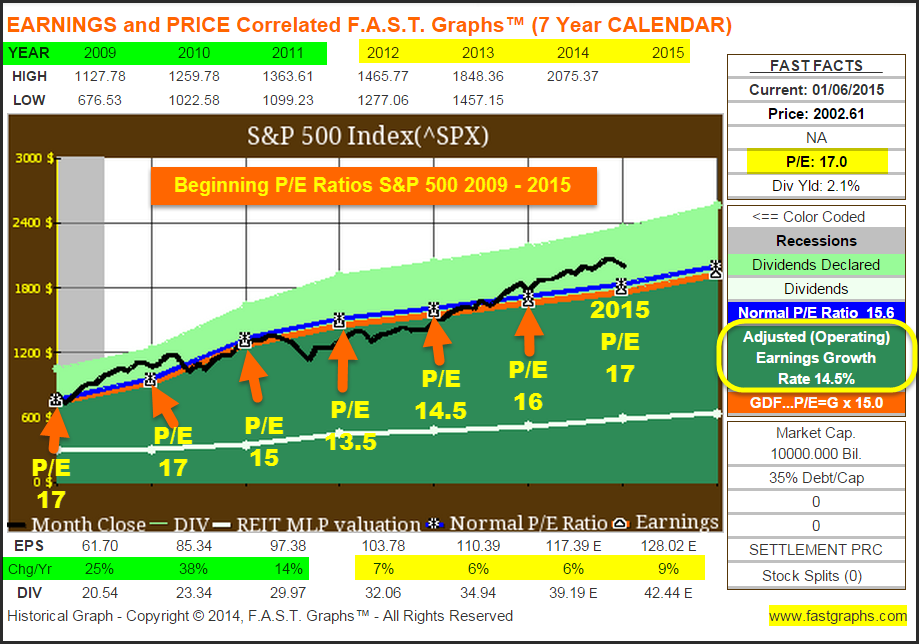
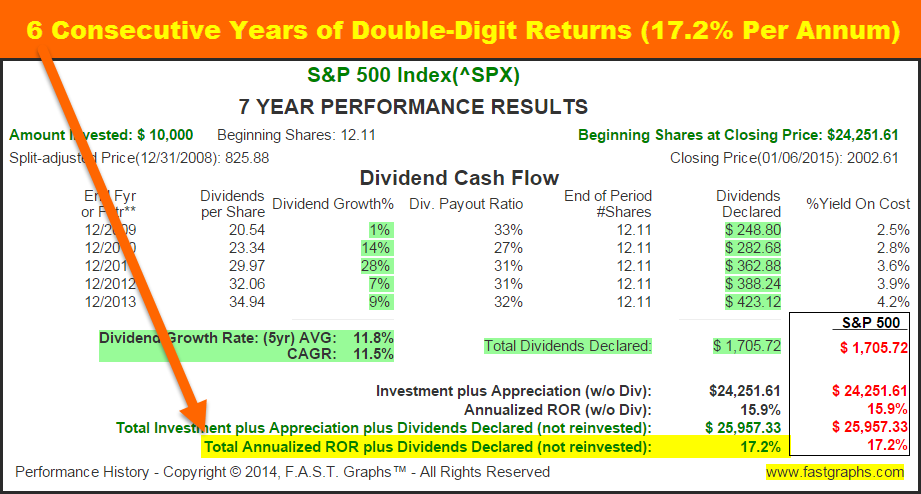
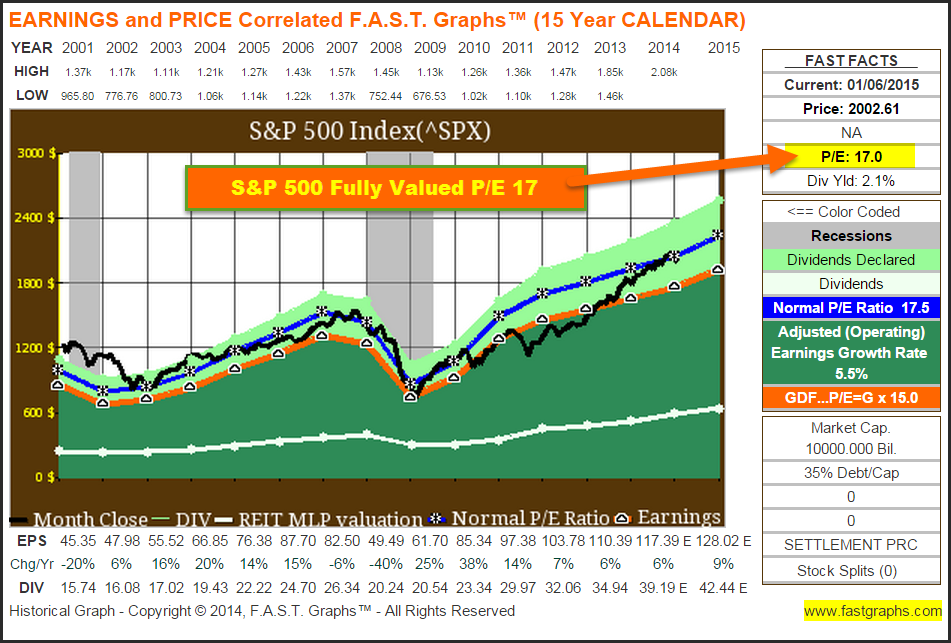
Calendar year 2014 closed as the sixth consecutive year of double-digit returns for the S&P 500. The following Earnings and Price Correlated F.A.S.T. Graphs on the S&P 500 since the beginning of 2009 provides important insights into how and why this occurred. First of all, the S&P 500’s earnings growth rate over this time frame averaged over 14% per annum. This is significantly above its longer-term historical norm of approximately 6% per annum. Earnings growth is a significant determinant of return for the S&P 500, and likewise for an individual company.
However, earnings growth alone is not the only important determinant of return. Valuation is also an important determinant and contributor to return. When valuation is in alignment and justified relative to earnings growth, future returns tend to equate with earnings growth over the long run. When valuation is high relative to earnings growth, future returns tend to be less than earnings growth. If valuation is low relative to earnings growth, future returns tend to come in greater than earnings growth.
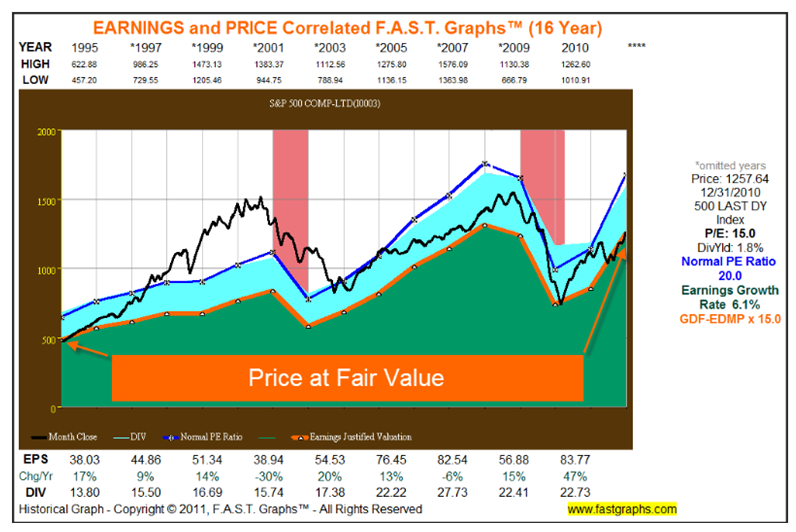
With the above principles under consideration, the S&P 500’s returns over the past six years make sense. At the beginning of 2009, the P/E ratio of the S&P 500 was approximately 17 and only modestly above a true worth valuation P/E ratio of 15. The S&P 500’s beginning valuation for 2010 was also approximately at a P/E ratio of 17. The S&P 500’s beginning valuation for 2011 was perfectly in alignment at a P/E ratio of 15. The S&P 500 started 2012 undervalued with a P/E ratio of approximately 13.5. The P/E ratio for the S&P 500 at the beginning of 2013 was also undervalued at approximately 14.5. Finally, 2014 started out very modestly overvalued at a P/E ratio of approximately 16 (see arrows on graph below).
The S&P 500: Strong Performance Since 2009
All in all, and for the most part, the S&P 500 has been in a reasonably fair value territory over the past six calendar years. This coupled with strong earnings growth over this time frame resulted in significantly above-average S&P 500 total annual returns of 17.2%. This is significantly above the index’s historical normal returns, but sound valuation and strong earnings growth over this time frame justify the results.
However, the reader should be cautioned that both reasonable recent historic valuations and earnings growth achievements can be partially attributed to the market and our economy coming out of the Great Recession of 2008 which ended in late spring 2009. Therefore, above-average earnings growth since 2009 was greatly impacted by three consecutive years of double-digit earnings growth as the market’s earnings recovered off of a low base (see green highlights on the Chg/Yr column on above graph). However, since 2011 earnings growth for the S&P 500 has more or less reverted to its 6% to 7% historical mean (see yellow highlights on the Chg/Yr column on above graph). Importantly, as I will illustrate later, future earnings growth for the S&P 500 is expected to remain in this 6% to 7% range or slightly higher going forward.
The S&P 500: 2015 and Beyond
First of all, allow me to emphatically state that I have a real problem with forecasting stock markets in the general sense. Instead, I prefer to forecast the intrinsic values of individual businesses based on their earnings justified fundamental values. I hold this position because I believe that it is not only possible, but also quite practical to analyze a specific business and then make an intelligent forecast (not a guess) but a rational estimation, based on the assimilation of fundamental facts, as to its past, present and future intrinsic value. Importantly, I’m not suggesting this can be done with absolute perfect precision down to the precise penny, rather I am suggesting it can be done within a reasonable range of rational probabilities.
In contrast, trying to estimate the collective results of a large group of companies such as the S&P 500 is a very daunting task. There are just too many variables and too many data points to contemplate from which to make a rational and/or reasonably accurate forecast. On the other hand, the evidence I’ve reviewed suggests that the earnings and price correlation and relationship is just as valid on an index as it is on an individual stock. In other words, earnings will be the primary driver of stock price for both a specific company and an index. However, current valuation in conjunction with earnings growth will be the determinate of future returns – assuming rational investment behavior.
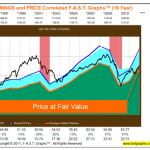
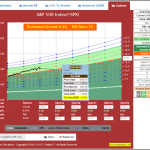
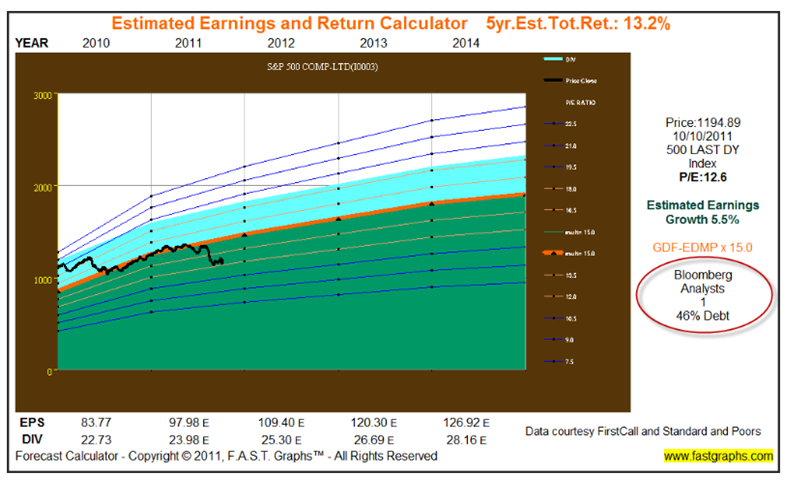
With the above said, I have offered my views on the relative valuation and future potential of the S&P 500 in past writings. On October 12, 2011, I penned an article found here where I indicated that the S&P 500 was cheap at that time. I include copies of the Earnings and Price Correlated F.A.S.T. Graphs that I presented in the article to support my thesis.
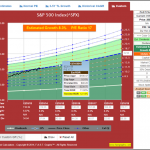
On January 15, 2013, I presented a similar article on the S&P 500 with an admittedly more provocative title found here.
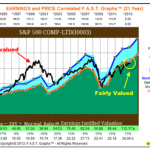
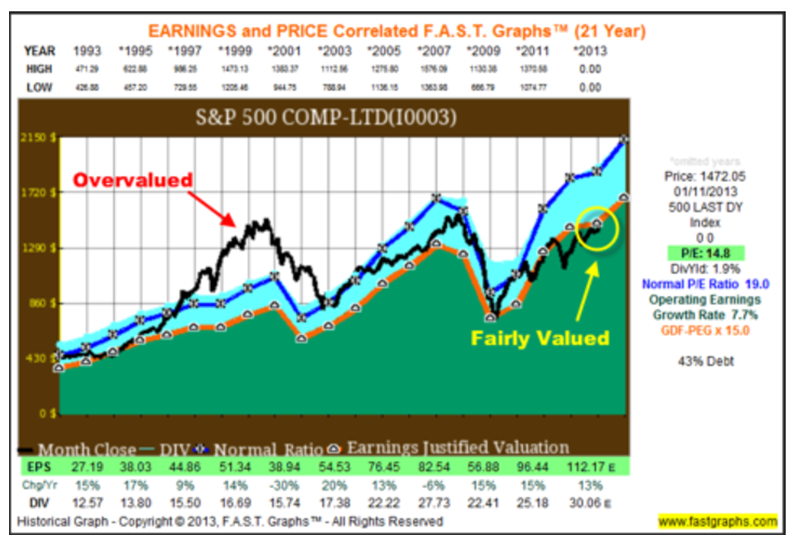
I have also included copies of the Earnings and Price Correlated F.A.S.T. Graphs, and a short excerpt that I presented in this second article to support my thesis at that time. As an aside, for those interested in studying investor psychology, the comment thread on this article is worth reading. Many people were still feeling the pain of the Great Recession and negativity and pessimism overruled reason in many cases. To me, this represented a classic example of the impact that emotion can have on market prices over the short run. Good news, sound and attractive valuations and strong earnings growth simply could not be believed or trusted by those in a highly-charged emotional state.
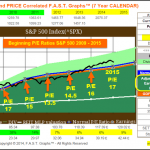
“Jan. 15, 2013: At this point, it’s important to state that historical F.A.S.T. Graphs™ valuation measurements are based on actual S&P 500 operating earnings as reported, and estimated earnings (numbers marked with E for estimate) come directly from the Standard & Poor’s website. This is in contrast to the very popular statistical S&P 500 valuations based on the Shiller P/E ratio calculation known as CAPE, which utilizes earnings calculated as a 10-year average. If you carefully study the earnings and price correlating graph above, it is obvious that earnings for the S&P 500 (the orange line) have mostly advanced with the exception of the two recessions of 2001 and 2008.”
The S&P 500: Early 2015 Valuation
I referenced the above past articles on the valuation of the S&P 500 that I authored for a couple of important reasons. First of all, I wanted to highlight the important perspective that the S&P 500’s strong performance over the past six years was functionally related to sound valuation and above-average earnings growth. To be clear, I was not attempting to blow my own horn regarding the prescient nature of my past work. Instead, my objective is to provide the reader insights into how and why the S&P 500’s recent exceptional performance was generated. But most importantly, to use this information as a backdrop and contrast in regards to where the S&P 500 sits today, and what we might expect from the index in the future and why.
As we enter 2015 with a blended P/E ratio of 17, the S&P 500’s valuation sits at the upper end of its historical normal valuation range since 2001 (the dark blue line on the graph). This does not necessarily imply that the index is significantly overvalued at these levels, but it does suggest that the index is currently fully valued. A review and study of the earnings and price correlated graph of the S&P 500 below clearly illustrates this view. Consequently, it should be clear that the sound and attractive valuation environment that investors have enjoyed with the index since the beginning of 2009 is not as favorable as it has recently been.
In my opinion, this does not necessarily suggest a collapse. However, I do believe it does suggest that the double-digit returns we have recently become accustomed to with the index may be coming to an end. Simply stated, current valuation is not as attractive as it was at the beginning of each year since the Great Recession. Higher valuation implies lower returns, and more importantly, earning lower returns at relatively higher levels of risk. I don’t believe that this undeniable fact should incite panic, but it does imply a more cautious approach and view regarding future return potential and risk.
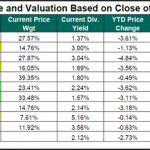
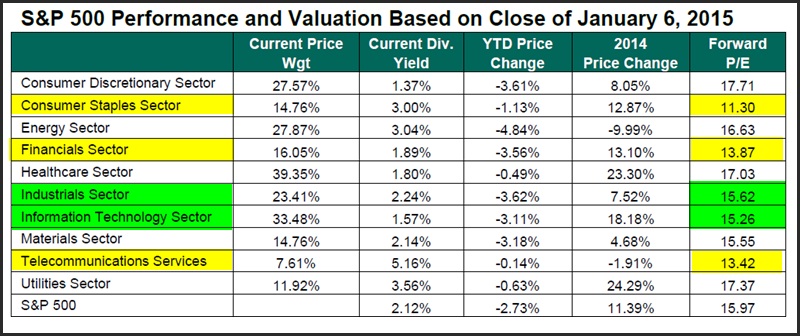
Keeping in mind that returns are a function of the combination of earnings growth and valuation, this next report, courtesy of S&P Capital IQ, illustrates the different valuation levels of the index by sector. In spite of the fact that the index is currently trading at a blended P/E ratio of approximately 17, here we discover that there are pockets of attractive valuation in certain sectors of the index with lower-than-average or fairly-valued forward P/E ratios. In future installments of this series, I will be reviewing and looking deeper into each of the 10 sectors, as well as examining individual company examples from each.
The S&P 500: Early 2015 Growth Prospects
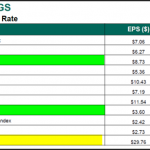
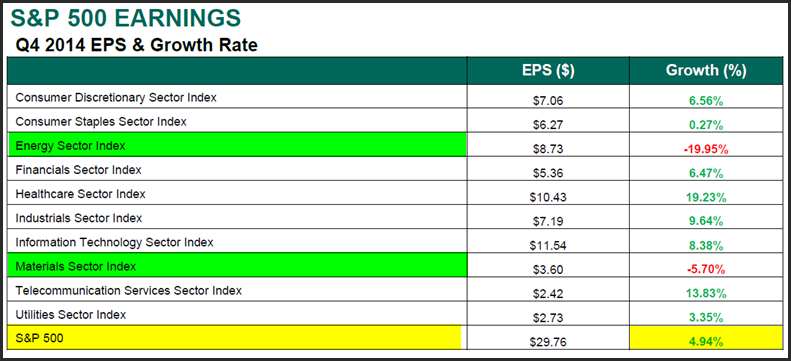
As I have often pointed out, I believe in a market of stocks rather than a stock market. Additionally, the market, as represented by the S&P 500, is also comprised of 10 different sectors. Just as individual stocks possess their own unique characteristics of growth and valuation, the same is true in a more general sense for the various sectors. The following, courtesy of S&P Capital IQ, presents the earnings growth rate of each of the 10 S&P 500 sectors for the fourth quarter of 2014. The 4.9% growth rate for the index as a whole is below recent historical standards. However, clearly there are both bright spots and others that are not so bright regarding last quarter’s earnings growth on a sector-by-sector basis.
S&P 500 Earnings Forecasts and Potential Return Calculations
As previously stated, I believe that forecasting the future value or growth of an index like the S&P 500 is difficult and complex. Therefore, I offer the following “what if” scenarios based on various assumptions and/or historical norms. The objective behind these calculations is not to provide a specific view of what the S&P 500 will do in 2015. Instead, they are offered as reasonable possibilities in order to provide the reader a perspective of what 2015 might hold for the index based on current valuation and earnings growth prospect realities.
Scenario 1: S&P 500 Historical Average or Normal Case
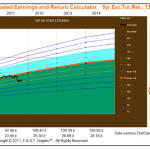
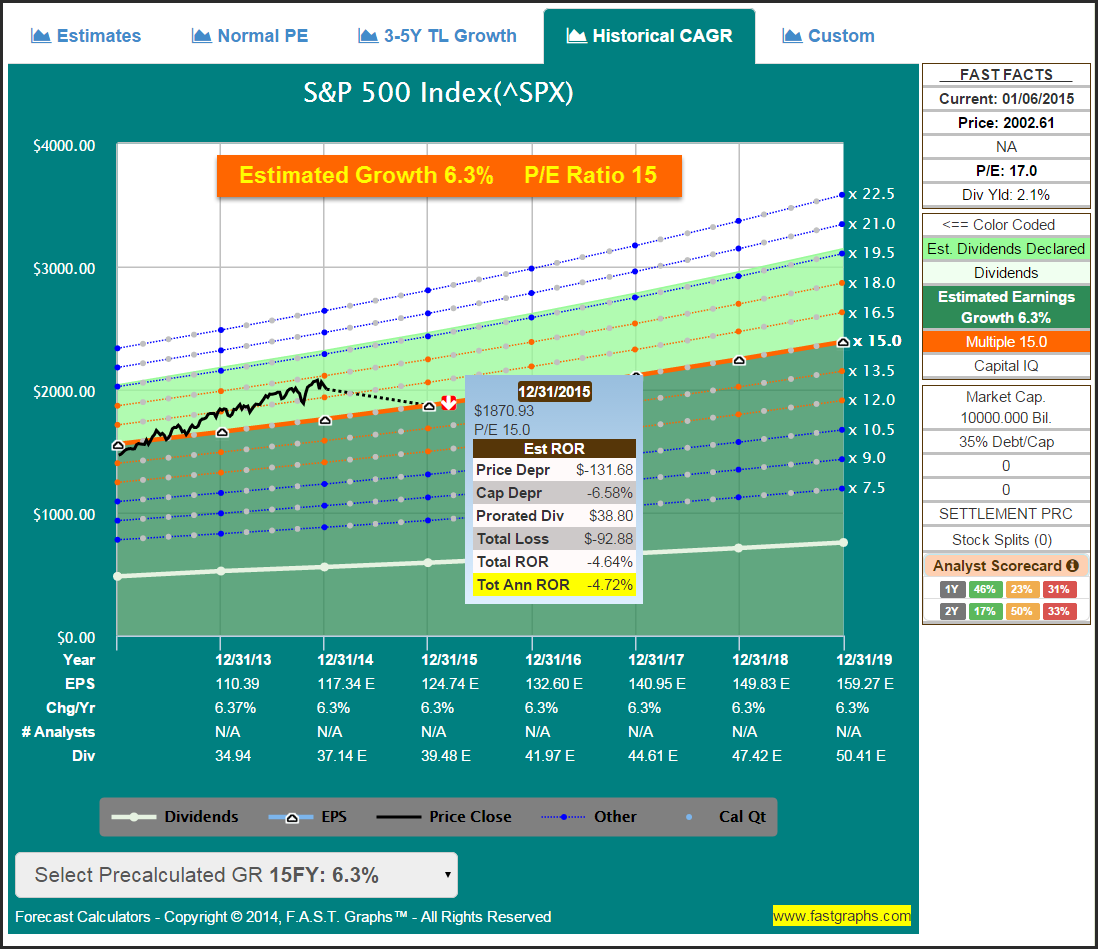
Utilizing the new and improved F.A.S.T. Graphs forecasting calculators, this first case assumes that the S&P 500 grows earnings in 2015 at its historical 15-year average rate of 6.3%. The following calculations further assume that the S&P 500 reverts to its fair value P/E ratio of 15. If both of these assumptions were to occur, the S&P 500 under this scenario would produce a -4.72% return in 2015 (see the yellow highlighted column on the pop-up). Although this is far from disastrous, it does indicate that future return risk is currently higher as we enter this year than it has been in recent years.
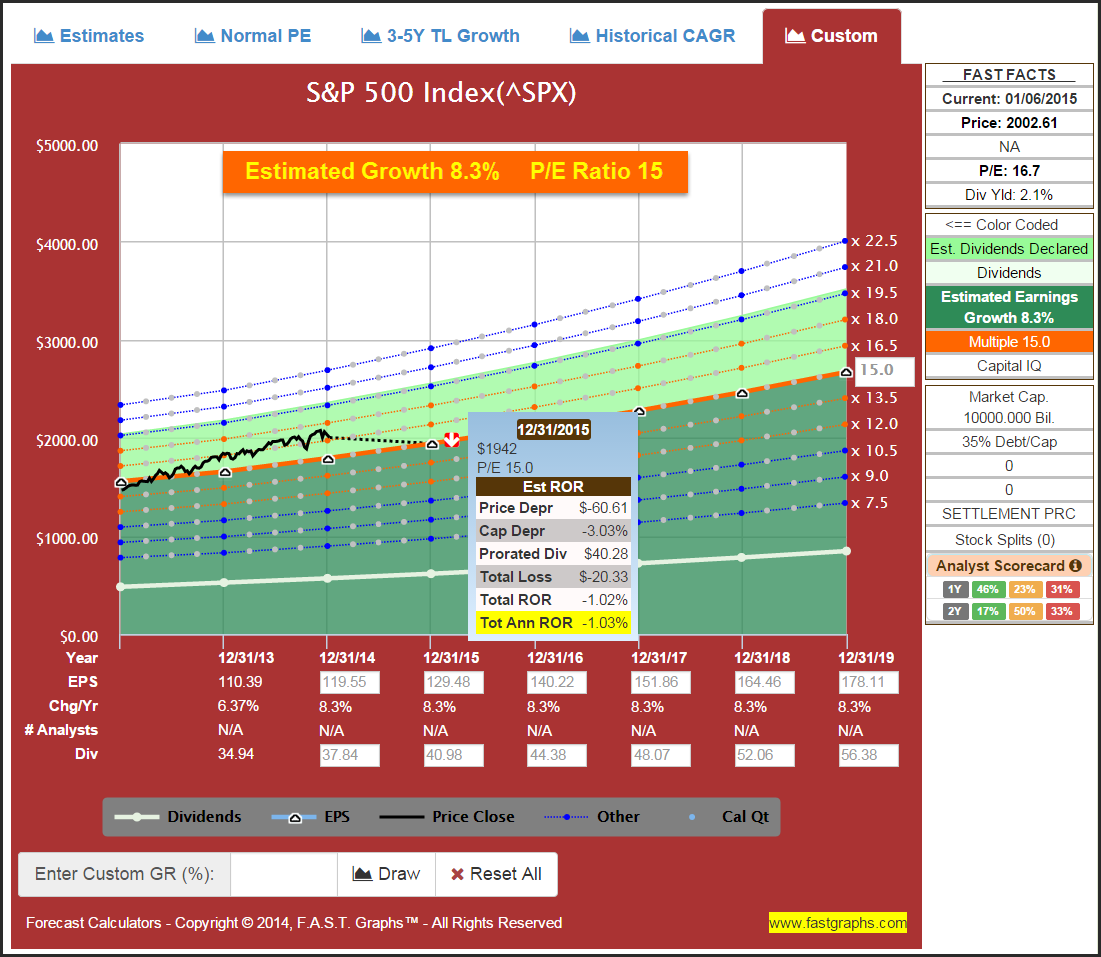
Scenario 2: S&P 500 Historical Average or Normal Case based on Consensus Long-Term Earnings Growth 8.3%
This second scenario assumes that the S&P 500 will grow earnings at the consensus long-term earnings growth rate estimate of 8.3%, and as was assumed in the first scenario, its P/E ratio would revert to a fair value of 15. This higher rate of estimated earnings growth would lower the 2015 loss to a more reasonable -1.03%. This return would certainly be nothing to write home about, but not an Armageddon scenario either.
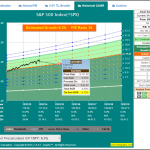
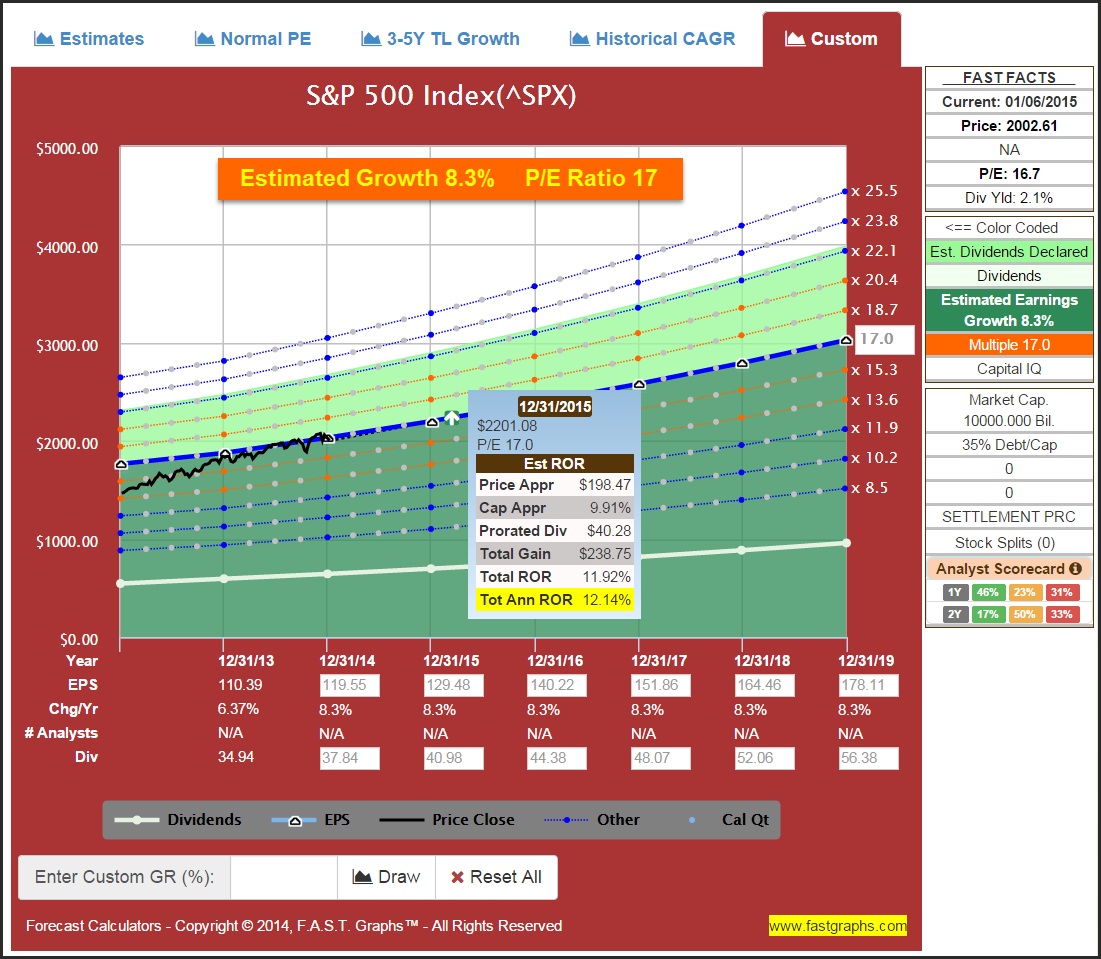
Scenario 3: S&P 500 Historical Normal P/E Ratio 17 Case based on Consensus Long-Term Earnings Growth 8.3%
My third scenario assumes that the S&P 500 does grow earnings at the consensus long-term earnings growth rate of 8.3%. However, in this scenario the S&P 500 maintains its current P/E ratio of 17, which is at the upper end of its historical normal valuation level. If these assumptions were to occur, the 2015 rate of return for the S&P 500 would calculate at 10.1%. This implies that the odds for a seventh consecutive year of double-digit returns for the index are at least a possibility. However, all of the stars would have to be in perfect alignment for this to occur.
Summary and Conclusions
The bottom line that I’m attempting to present with this article, as well as the above earnings estimate scenarios, is a realistic look at what might be in store growth- and return-wise for the S&P 500 in 2015. The total returns achieved by the S&P 500 since coming out of the Great Recession have been extraordinary. However, the greater insight comes from understanding and realizing how those above-average returns were achieved. I think the evidence presented is clear that attractive valuation and above-average earnings growth generated the above-average returns for the index.
As we enter 2015, a couple of important things have changed for the S&P 500. First of all, the easy money that the index constituents made (earnings growth) can be to a great extent attributed to the low base that the Great Recession set. Consequently, especially in the first few years after the recession, earnings growth rates for the index were high as profitability returned to more normal levels. As a recovery time has lengthened, future returns for the S&P 500 in the aggregate are highly likely to revert to more normal levels. Since earnings growth is such an important determinant of future returns, logic and common sense would indicate future returns moving back to a more normal 6% to 7% range.
The second important factor of course is valuation. The current blended P/E ratio of the S&P 500 sits at approximately 17. Although this is moderately above the fair value 15 P/E ratio that has been common for the index over the past six years, it is far from a bubble territory. Nevertheless, the slightly higher valuation as 2015 begins suggests less return at higher levels of risk than we have recently experienced. Consequently, in the general sense, there might be less opportunity for the index as a whole going forward.
However, since it is a market of stocks and not a stock market, this does not simultaneously imply that attractive equity investment opportunities are no longer available. As indicated above, there are sectors where the current P/E ratios are below the fair value P/E ratio of 15. But even more importantly, my initial research indicates that there are fairly valued opportunities in every sector of the S&P 500, even those that are fully valued in the aggregate.
The next 10 installments of this series will take a deeper look at each of the 10 S&P 500 sectors. There are general characteristics that differentiate each of these sectors, and I plan on elaborating on those specific and unique characteristics that are generally manifest in each sector. However, I also intend to cover individual selections from each sector to illustrate that stereotyping a company based on its sector is not always logical. In other words, within each sector there are unique and attractive companies to be found.
In the general sense, the overall market might be fully valued today. As a result, the returns of the S&P 500 going forward may not be as good as they have recently been. Additionally, because of the tailwinds of low valuation and above-average growth, it has been difficult to beat the market in recent years. However, as the investment environment for the index has changed, that may not be the case going forward. In other words, I believe that 2015 will be more of a stock picker’s market than it has been over the past several years. I contend that it is a market of stocks, and not a “stock market,” so I suggest that investors behave prudently and choose wisely as we enter 2015.
In Part 2, I will take a deeper look at the energy sector. This is clearly the most troubled sector of the 10 comprising the S&P 500. On the other hand, the old Wall Street adage “buy on bad news and sell on good news” might apply. In other words, I will be examining the question: Is the energy sector full of risk or opportunity?
Disclaimer: The opinions in this document are for informational and educational purposes only and should not be construed as a recommendation to buy or sell the stocks mentioned or to solicit transactions or clients. Past performance of the companies discussed may not continue and the companies may not achieve the earnings growth as predicted. The information in this document is believed to be accurate, but under no circumstances should a person act upon the information contained within. We do not recommend that anyone act upon any investment information without first consulting an investment advisor as to the suitability of such investments for his specific situation.
Source:
The Stock Market 2015: A Sector By Sector Valuation Perspective – Part 1 An Overview
Disclosure: The author has no positions in any stocks mentioned, and no plans to initiate any positions within the next 72 hours. The author wrote this article themselves, and it expresses their own opinions. The author is not receiving compensation for it (other than from Seeking Alpha). The author has no business relationship with any company whose stock is mentioned in this article. (More…)
Link:
The Stock Market 2015: A Sector By Sector Valuation Perspective …

