
The Stock Market Is In Trouble – How Bad Can It Get? | Zero Hedge
Submitted by Pater Tenebrarum via Acting-Man.com,
A Look at the Broader Market’s Internals
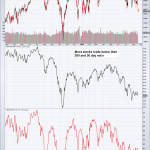
We have previously discussed the stock market’s deteriorating internals, and in light of recent market weakness want to take a brief look at the broader market in the form if the NYSE Index (NYA). First it has to be noted that a majority of the stocks in the NYA are already in bearish trends. The chart below shows the NYA and the percentage of stocks above their 200 day and 50 day moving averages, which is 39.16% and 33.77% respectively.
When more than 60% of stocks in the broader market trade below their 200 dma with the SPX not too far off an all time high, it is clear that cap-weighted indexes are helped up by an ever smaller number of big cap stocks. This typically happens near important trend changes, but it is not always certain that the market will decline significantly when such a divergence occurs.
Is he about to make his entrance?
Cartoon via wallstreetsurvivor.com
One possibility is also that the market merely corrects, and resume its rally once a sufficient number of stocks becomes oversold. That said, the broader market hasn’t made any headway in more than half a year, with the volatility of major indexes and averages declining to multi-decade lows. It is certainly tempting to classify this period as one of distribution, especially given recent weakness.
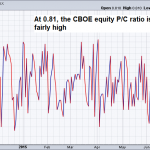
In the short term, the large number of stocks in a downtrend may actually help produce a bounce, especially as some sentiment indicators such as equity put/call ratios have increased to a level usually associated with short term lows. However, we believe one has to take a differentiated approach to interpreting sentiment and positioning data at this juncture and we will explain why in more detail further below.
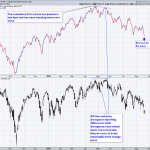
First let us look at the NYA internals mentioned above. In addition to the percentage of stocks below their 200 and 50 day moving averages, we show the cumulative NYA advance/decline line in the second chart below. The A/D line has been in a downtrend since late April.
The NYA and the percentage of stocks still above their 200 and 50 day moving averages. The market’s momentum peak occurred more than a year ago, in early July 2014 – click to enlarge.
The cumulative NYA A/D line has peaked in late April – then a divergence between the A/D line and the NYA was created in May. Such divergences don’t have to be meaningful, but they do occur at every major trend change. In other words, there doesn’t have to be a trend change when such divergences are spotted, but no trend change happens without them – click to enlarge.
The CBOE equity put/call ratio is currently at 0.81 – this is in the general area (0.70-1.10) that is often associated with short term lows – click to enlarge.
The Sentiment and Positioning Backdrop
Several recent articles at Marketwatch are trying to make the point that a “contrarian bullish situation” now exists. One author writes “Great News: Investors are Dumping US Stocks”, but goes on to explain that they are instead buying international and more specifically, primarily European stocks. This makes no difference in our opinion – as long as they are buying stocks, they are not bearish.
There continues to be a widespread conviction that retail investors have to beat down the doors and rush into the market before it can top out. We believe this is actually a “bearish hook”. This has been a “bubble of professionals” for 6 years running and this isn’t going to change anytime soon. First of all, retail investors have been burned twice over the past 15 years by two of the worst bear markets in history. Secondly, demographics dictate that retiring boomers will become sellers of stocks for a number of years. They simply cannot take the risk of buying into an overvalued market again in their retirement years.
Anther article discusses recent sentiment/positioning data and is more interesting from our perspective. As to its assertion that “insider buying has increased and has therefore turned bullish”, we would note that insiders have been dumping stocks left and right for three years running. One or two weeks of buying are hardly making a dent in the longer term picture. Moreover, we are not appraised of the sectors in which the buying is occurring. We only know fur sure that it isn’t happening in the stocks that are actually holding the market up – i.e., assorted big cap tech, biotech, retail, etc. stocks.
As we have recently reported, there has been a huge surge in buying by insiders in the gold sector – this is very rare, and therefore worthy of attention. We strongly suspect that insider buying is also occurring in other beaten down commodity stocks, but these stocks cannot be expected to push up the market as a whole – their share of total market cap is too small (their collapse hasn’t dragged the indexes down either after all). If e.g. the stocks of copper and iron ore producers were to rally, this would be a great relief to long-suffering holders of these shares, but it wouldn’t help the overall market much. Commodities are quite oversold though, and a rally in these sectors wouldn’t surprise us.
Let us look at some of the other factors mentioned in the article:
1 The Investor’s Intelligence Bull/Bear Ratio, which polls investment pros on their market outlooks, fell last week for the third week in a row, to a 10-month low of 2.16. A reading below is a clear buy signal, and we are pretty close.
2 The Chicago Board Options Exchange (CBOE) put/call ratio, on a three-day basis, recently rose to 0.8. Anything above 0.7 is bullish because it represents excessive pessimism, in that the number of puts purchased compared to calls has reached relative highs. Remember, put options give the right to buy a stock at a preset price. So they can be seen as insurance against a market decline, or a bet that a drop will happen. The put/call ratio measured over the 10 days also shows a high level of pessimism, which is bullish, says Bruce Bittles, chief investment strategist at brokerage Robert W. Baird & Co.
3 The Ned Davis Research Crowd Sentiment Poll recently showed extreme pessimism, also bullish in the contrarian sense.
We will address these in more detail further below (except for the put/call ratio, which we have already commented on above), but for now we would note that all of this is important only for the short term – and it may actually not even be overly relevant to the short term. Remember what we said above: this is a “bubble of professionals” – which has made sentiment indicators highly unreliable on the way up, as many of our readers probably recall. The question is, why should they be any more reliable on the way down?
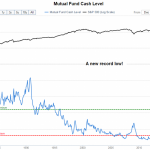
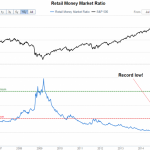
Furthermore, all sentiment indicators that are relevant for the long term, are in the “beyond good and evil” zone and have been there for quite some time. Three of those are shown below: Margin debt, the mutual fund cash ratio, and retail money fund assets as a percentage of the S&P’s market cap. We are commenting below the charts as to their significance.
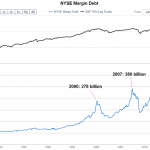
Margin debt is just off an all time high, well above previous peaks. If the market weakens beyond a certain point, this huge amount of margin debt could easily trigger an avalanche of forced selling. It isn’t going to sink the market per se, it just creates the potential for a very large sell-off – click to enlarge.
Mutual fund cash to assets ratio. At an all time low of 3.2%, mutual fund managers are definitely “all in”. They are not going to be buyers if the market declines – on the contrary, if they are hit with redemptions, they will turn into forced sellers as well – click to enlarge.
Retail money market funds as a percentage of the S&P 500 market cap sits at an all time low as well, far below previous historic low points. We can safely conclude that retail investors aren’t going to step up to the plate either – click to enlarge.
At the end of June we sent a list of objections to a friend with respect to the widely touted phrase that this is such a “hated” bull market. Many of the data in the list have been put together by Robert Prechter of EWI and we added a few observations of our own. The list inter alia contains references to the Investors Intelligence (II) Poll and an indicator published by Ned Davis, which are both mentioned in the Marketwatch article quoted above. We have highlighted them.
Once again, this list shows you something that is relevant from the perspective of a different time frame – namely the long term. A dip in the II poll may help create a short term low, but the long term data on this poll are actually nothing short of frightening. Given that this was posted in late June, some of the percentages may look slightly different by now, but not by much.
- The percentage of cash in mutual funds has been below 4% for all but one of the past 70 months. At the peak of the late 1990s tech mania in 2000, it stood at 4.2%
- Rydex bear assets have practically been wiped out. The amount left in bearish Rydex funds is now so small, that the ratio between bull and bear assets has soared to nearly 30. It was at approx. 18 at the year 2000 peak.
- Margin debt is at an all time high (approx. 82% above the peak level of 2000 in nominal terms), and investor net worth is concurrently at an all time low, in spite of soaring asset prices (people have borrowed so much to buy stocks, that they have record negative net worth in spite of the SPX nearly at 2200 and the NAZ at a new ATH.
- If the CAPE (Shiller P/E) and Tobin’s Q ratio were to peak here, it would be their fourth, resp. second highest peaks in history (since at least 1876, so we may assume all of history, as markets never got this overvalued prior to the fiat money era). The previous peaks that were close to the current ones are the who’s who of bad times to invest in stocks, to paraphrase John Hussmann: 1929, 2000 and 2007 – that’s it. No other time in history is comparable.
- The valuation of the median stock and the price/sales ratios are both at all time highs (even exceeding the year 2000 peak, which hitherto stood alone as a monument to stock market insanity).
- The ratio of bullish to bearish advisors in the Investor’s Intelligence survey finally eclipsed the peak of August 1987 last year. The 30-week moving average of the bear percentage is at a 38 year low, while the 200-week moving average of the bear percentage (at 21.44%) is the lowest in the entire history of the survey. There has never been similarly persistent bullishness, which is astonishing in light of the fact that the past 15 years have seen two of the four worst bear markets in history. By the way, all these sentiment-related data are the exact opposite of their readings in 1982, when the secular bull market began. Back then, people were extremely cautious and bearish, in spite of the fact that the market was up nearly 100% from its late 1974 low.
- The ratio of money in retail money funds to market cap is – you guessed it – at an all time low, by a huge margin. It is nearly 50% below the levels recorded in 2000 and 2007. People are evidently convinced that cash is trash.
- The DJIA’s dividend yield has been below 3% for 96% of the time since 1995, i.e., over the past 20.5 years, the dividend yield has been above 3% in only 9 months. Prior to 1995, it managed this feat only in a single month: in September 1929.
- According to Ned Davis, the stock market allocation of US households is at its third highest since 1952 – the only two exceptions are 2000 and 2007 (not the happiest moments in time to be loaded to the gills with stocks).
We continued as follows:
Admittedly, none of this tells us how much bigger the bubble will become. Money supply growth is still fairly brisk (TMS-2 above 8% annualized) and administered interest rates remain at zero, with the Fed evidently scared of the 1937 precedent (their entire policy is informed by a single and highly unusual event in economic history, the Great Depression). It could thus become still crazier.
However, it would be a big mistake to call this bull market “unloved” based on anecdotal data like postings in financial forums. In reality, it is not only one of the most overvalued, but definitely one of the most over-loved markets in history, perhaps even the most over-loved overall. Many will remember the day trading craze and CNBC’s ratings in the late 1990s, and it is true that the underlying mood seems outwardly more subdued this time around (this is no wonder, as many people have a very negative assessment of the real economy. After all, the fact that the BLS is simply not counting people as unemployed once they have been jobless for a certain time period makes them no less unemployed).
Let us not forget though, it is not opinions that count, but human action. And by their actions (as evidenced by the positioning data listed above), investors have never been more certain that a bull market would continue than they are today.
There is certainly no reason to change this assessment, even though there are now signs that the market is getting sufficiently “hated” and oversold in the short term to allow for a bounce. One must not lose sight of the fact though that in spite of the strength in the major indexes, most investors are actually losing money, simply because most stocks are actually in a downtrend since April. Sentiment is simply following prices in other words.
Money Supply Growth
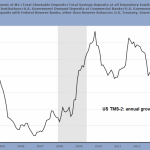
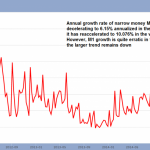
As we frequently point out, there is one reason not to get carried away with bearish projections either, at least not yet – and that is the pace of money supply growth. Below you can see that broad money TMS-2 has been growing at 8.4% annualized as of the end of July, while annualized growth of narrow money M1 has re-accelerated in the week to August 3 to slightly above 10%, after dipping to as low as 6.15% at the end of July. In both cases, growth is mired in a sideways to downtrend though, and may no longer be sufficient to keep the market going higher.
Annual growth of broad money TMS-2 – click to enlarge.
Annual growth of M1 – click to enlarge.
Conclusion
Even if it is short term oversold, this is actually a quite dangerous market – caveat emptor, as they say.
Average:
5
Your rating: None Average: 5 (5 votes)
Visit source:
The Stock Market Is In Trouble – How Bad Can It Get? | Zero Hedge

