
The Stock Market's Seven-Year Itch | Zero Hedge
Excerpted from ‘Tangible Ideas’ via Sean Corrigan of Diapason Commodities,
So where does this leave us, in financial markets, at the mid-point of the year, other than with asset prices through the roof?
As can be gathered from the faux lamentations issuing forth from those central banking Uriah Heeps who sit wringing their hands at the dangers inherent in a ‘search for yield’ which they themselves have driven, sovereign bonds are currently at their lowest yields, longest durations, and hence most adverse risk:return settings of the past half-century.
In turn, this has led to a similar compression of credit spreads to the point that junk yields are trading sub-5% nominal, sub-3% deflated for the first time in history, levels at which they spread to US treasuries has also gone blow the 250bps area which marked the eve of the last three major credit events in 1994, 1997, and 2007. Needless to say, they are also historically cheap to stock earnings yields, actually trading below them.
Stock multiples are also among the most favourable vis-à-vis corporate yields in three decades, while dividend yields – though themselves in only the 5th percentile of the last six decades’ range – are atypically well in excess of both the Fed funds rate and the 3-month T-bill rate – again for the first time in over half a century. This, as we shall shortly see, is perhaps the single most compelling reason why stock markets seem to have an inexhaustible supply of bidders.
What is good for junk is also becoming true for emerging market bonds, even if the broader indices, such as the EMBI is still some 60bps above the post-2007 lows of 220bps. Similarly, though Bono and BTP spreads have seen some profit-taking since hitting four-year lows early in June, crashed to their lows, they still trade at or through UST equivalents at the lowest nominal yields in history. For all the rumblings about debt traps, after-CPI yields in Italy, at around 2.5%, are smack on the midmean of the whole EMU era and thus substantially reduced from the 6.5% average which was laid down in the last decade of the lira’s life.
When it comes to equities themselves, it might appear that, just looking at P/E ratings – added to a little eternal optimism regarding the prospect fro the growth in the denominator, whether as a result of buybacks or earnings growth – the market has not yet gone beyond the bounds of sanity.
What we can say, however, is that the fraction of profits rung from each dollar of sales has become greatly elevated – running at just under 10% for manufacturing companies, for example, which is twice the 5% typical of the last four decades of the 20th century. This has allowed earnings to grow enough to keep the buy-side happy, even though revenue growth has become very lacklustre of late, to the point that it is barely positive in deflated terms, often a harbinger of a more widespread economic malaise.
Fundamentally, if profits are growing as a share of sales, we must be deducting less from those receipts. As a share of EBIT, both the tax take and the interest pay-out have fallen substantially over the cycle. Whereas, in the mid-1990s, interest was eating up half of pre-tax operating income and taxes were taking a third of the remainder, currently the former reduction has fallen to around 30% and the latter to a highly depressed 20%. Note, however, that in 2013, the ROIC was a creditable 5.4% nominal, 3.3% real, while the realized cost of capital (using dividends and tax-adjusted interest paid) was 3.3% nominal, 1.2% real. This, you will note, nevertheless left the residual ‘economic’ profit rate at 2.1% nominal or precisely zero after taking account of the intervening general rise in prices.
The point here is that this is a finite, if long-lived, process: the tax rate cannot continue to fall without limit while interest costs are already at historic lows (so much so, in fact that corporates, as we have noted are hardly shy about increasing their susceptibility to any future adverse changes in them). Whenever the day arrives, there will necessarily come a point when earning cannot grow faster than revenues and if, when that occurs, revenue growth itself remains enfeebled, earnings, too, must begin to disappoint.
Something of the sort may perhaps be found a parsing of the latest Duke/CFO Magazine survey of US business executives. This 405-strong sample found that the outlook for both revenues and earnings had darkened appreciably in the pact six months. Last autumn, sales were seen to be about to quicken to a 6.8% rate of increase taking earnings up to a 14.3% rate of climb. Now, revenue growth is forecast to reach only 5.7% yoy, with the earnings outlook slashed to 4.1%. That latter is the worst such outcome of their prognostications since the third quarter of 2009 and stands in stark contrast to sellside expectations, as reported by S&P, for a 25% gain.
As if that were not enough, the price to book of equities is also rising alarmingly, especially price to tangible, replacement cost book, a measure which has only been higher in the run up to the Tech bubble peak. So, to sum up, little account has been taken of the fact that a couple of the main factors which have allowed margins to expand so greatly are presumably fast approaching their expiry date; the price to forward earnings being bandied about only seems reasonable on a Street guesstimate which is no less than six times that offered by corporate insiders; price to cash flow is in the topmost six percent of the distribution; the liquidation value of the average company would leave creditors well under water, while net debt as a proportion of either cash flow or net worth is approaching previous highs.
That all hardly makes for a compelling investment case, even without wondering about the herding effects currently at work in the market.
Which only leaves us with commodities – bastard children of the last few years’ bull market, still greatly despised, outside of the energy sector, at least. In truth, in the year so far their returns have been anything but lacklustre. As of writing in the last week of June, the basket has returned a healthy 7.7%, led by Ags on 12.5% and lagged by industrial metals on just 1.3%. With such a score, they have so far outpointed US bonds (3.4%), Junk (5.6%), US Small Cap (2.7%), EM equities (5.5%), World ex-US stocks (6.1%), and the US itself (7.2%). Only EM bonds – plus-8.5% – have done any better among the major asset classes.
* * *
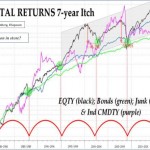
What this long preamble is aimed at doing is alerting the reader to the possibility that while the trend line chugs on upward with the bond market at ~6% nominal, any divergence of other asset class returns too far from this line may well sow the seeds of their own dampening and subsequent phase reversal. Here we would ask you to squint at the accompanying, start date-normalized plot of returns to see if you, too, can make out what appears to be a tantalizing, seven-year waxing and waning of equity returns away from and back to the trend, alternating Blue Sky bull markets like the one we have been in for much of the past five years with more short-lived, Icarus-like descents of the order of 50% where they converge not just with bonds, but commodities, too.
If past is indeed sometimes prologue, this simple chart might be hinting that a rally similar in arithmetical range and time-span – if not in percentage gain – to the Tech bubble itself is becoming dangerously overripe and that, if so, the most propitious time to effect an exit is not when the fat lady interrupts her warbling of the anthem to shriek, ‘Fire!’ at the audience instead.
Credit:
The Stock Market's Seven-Year Itch | Zero Hedge
See which stocks are being affected by Social Media

