
The Stock Market's Uptrend Is Set To Continue (VTI,WFC)
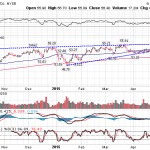
The most common debate amongst traders is when the prolonged uptrend across the financial markets will come to an end. After such a long run, it is reasonable to believe that the trend is nearing overbought levels and could be preparing to make a sudden reversal, but based on the weekly chart of the Vanguard Total Stock Market ETF (VTI), from an active trader’s perspective, the next leg of the trend is likely to be higher. Notice how the bulls have managed to send the price above the resistance of the previous swing high of $110.28 (blue circle) and how this move is happening at the same time as the MACD buy signal (black circle). This technical buy signal and confirmation suggest that the upward momentum is set to increase and many will likely hold a bullish outlook until the price of the fund closes below the ascending trendline or the 200-day moving average depending on risk tolerance. (For more, see: A Primer on the MACD)
VTI Fund Fundamentals
For those who don’t follow the VTI ETF, the fund seeks to track the performance of large-, mid-, and small-cap equity across growth and value styles. The fund is extremely liquid, with total net assets of more than $406 billion and trades with an ultra-low expense ratio of 0.05%, which is 95% lower than the average expense ratio of funds with similar holdings. The managers of the fund attempt to ensure that it is fully invested and that the fund remains diversified across different sectors. Taking a look at the table below, you can see that the heaviest sector weighting is in financials, technology and consumer services, which helps give the fund a slightly higher beta than a standard index. (For more, see How Does Beta Measure a Stock’s Market Risk? or Shifting Focus to Sector Allocation)
Sector
Weighting (%)
Financials
18.80
Technology
16.00
Consumer Services
13.80
Health Care
13.50
Industrials
12.50
One of the bets methods for those traders looking to create a watch list of high quality companies is to examine the table of VTI’s top holdings shown below:
Company
Weighting (%)
Apple Inc. (AAPL)
3.2
Exxon Mobil Corp. (XOM)
1.6
Microsoft Corp. (MSFT)
1.6
Google Inc. (GOOG)
1.4
Wells Fargo & Co. (WFC)
1.2
Source: personal.vanguard.com
Wells Fargo & Co. Breaking Higher
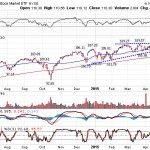
Taking a look at the chart of Wells Fargo & Co below, you can see the similarities between it and VTI shown earlier. The move above the upper resistance is a technical breakout that is often followed by heightened volatility and a sharp move higher. The proximity of the lower trendline and major moving averages helps maximize the risk/reward setup of entering a position at the current level. From a risk management perspective, we’d expect traders to place stop-loss orders below either $54.68 or $52.62 depending on risk tolerance. (For more, see Watch These Stocks for a Breakout)
The Bottom Line
While many argue that the broad market trends are about to reverse, strategic traders are looking to the Vanguard Total Market ETF and its top holdings, which are telling a different story. The recent breaks above clearly identified levels of resistance suggest that the upward momentum is set to continue and the nearby trendlines are creating some of the most interesting risk/reward opportunities that traders have seen in months. )For further reading, check out: The Benefits of ETF Investing)
Source:
The Stock Market's Uptrend Is Set To Continue (VTI,WFC)

