
This Chart Of Stock Market Inflection Points Is … – Business Insider
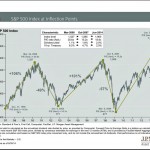
Every quarter, JPMorgan Funds publishes this annotated chart of the S&P 500 since 1997.
It highlights the last two stock market peaks and subsequent crashes.
Back when we saw it in April 2013, the S&P 500 was at 1,569, which was just points from the Oct. 9, 2007, high. Back then, the message was that valuations were actually attractive despite the elevated price levels.
Unfortunately, that can’t be said today.
At around 1,960, the S&P 500 is trading at around 15.6 times forecasted earnings, which is higher than 15.2 in 2007. And this comes after a 190% run up, which compares to the 101% gain ahead of the last market crash.
There’s obviously other things to consider than just forward earnings.
But the bottom line: The stock market definitely isn’t as cheap as it has been in recent months and years.
SEE ALSO: Here’s JPMorgan’s Ultimate Guide To Everything Happening In The Markets
More:
This Chart Of Stock Market Inflection Points Is … – Business Insider
See which stocks are being affected by Social Media

