
Trading Through the (Possible) Tapering — Trading Concepts | E …
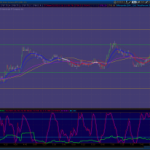
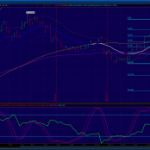
Happy Friday, Friends. I’m always sorry to see the non-farm payrolls report go, as the volatility around it creates a great trading opportunity taught by Todd Mitchell as the “First Half Hour Breakout”. Like much of what Todd teaches, the method lends itself to additional uses, and data releases that tend to generate strong and rapid reactions from the market are good candidates. Today’s stronger than expected report (+203k vs expectations of an increase of 180k, bringing the headline jobless rate down to 7%) created profit potential first on the downside break, then the upside. That doesn’t happen often enough, but it’s beautiful when it does. The risk is a quick spike or drop that ends short of a profit target, since the rebounds can also be quick, intense, and potentially expensive. Today, it was a winner.
Stronger employment growth, pointing to a growing economy, would normally be considered good news, but these, of course, are not normal times. Equities have been sailing higher, backed by a strong wind from the Federal Reserve. The Fed, as you know, has been buying vast amounts of Treasury and mortgage-backed bonds, keeping long rates lower than they would otherwise be, while lending to banks at the short end of the yield curve at, basically, zero. With the yields from bonds and money market funds so low that a fair number of stocks offer dividends that are higher than the coupon from a 10-year Treasury note, stocks (and equity futures) have benefited.
The Great Fear of market participants is that the Fed will begin to unwind the purchases at the long end of the market, a process known as “tapering”. If interest rates on fixed income securities move higher, the argument goes, bonds will become more attractive relative to stocks, and the latter will decline, possibly dramatically. I have my own views, but they don’t matter; to the extent that I’m trading futures from a three minute chart, my macro views are irrelevant, and I’m likewise content to take my cues from the price action when looking at longer-term trades.
It’s still helpful to have a sense of what’s driving market sentiment. One shortcut to get a sense of bonds versus stocks is the ticker TNX, which is just a chart of the yield on 10-year Treasury notes. That closed at 28.81; moving the decimal point one place to the left offers the T-note yield, in this case 2.881%. If the yield starts to tick up, it’s something to keep an eye on, since 3% – which would be shown as 30.00 – is a generally accepted line in the sand. It may ultimately prove to be meaningless; stocks may well be able to go higher with rates considerably above 3%. On the first test, however, I would expect equities and equity futures to get hit, possibly significantly. At that point, we can take direction from the price action in determining whether a downside reversal or a buying opportunity is occurring.
Money managers running taxable funds will be selling stocks that have been lagging as December proceeds, taking losses that can be used to offset gains in winners. They will not be looking to sell stocks that have moved strongly higher this year, since that will generate tax liabilities. That may mean that as the month wears on, a relatively few stocks – think NFLX, PCLN, GOOG and the like – will tend to see the bulk of the gains, since even the managers who haven’t owned them for much of the year are likely to want to show that they’re on the books when they generate their year-end client reports.
Best of luck today, and have a great weekend!
Follow this link:
Trading Through the (Possible) Tapering — Trading Concepts | E …

