
Turning Big Data into Fast Data to Speed Brain Research A Smarter …
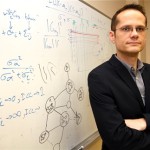
Mark Daley, Daley is Associate Professor & SHARCNET Research Chair at Western University
By Mark Daley
The tools and methodologies of “Big Data” provide us with new – necessarily automated – ways to boil down vast quantities of data into a form that is easier to digest. Critical tools include algorithms for dimensionality reduction, machine learning and large-scale visualization.
Beyond Big Data, many researchers are also beginning to face the related challenge of “fast data” – that is, real-time, streaming data for which an analysis is only useful if the results can be had quickly. For example, imagine a system designed to predict adverse weather events to mitigate losses to human life or damage to property. Clearly, the prediction is not useful if it comes 12 hours after the event.
To achieve “fast data” you need access to the right technology, and for my team, that has been access to the SOSCIP research-dedicated IBM Cloud platform. Similar platforms have begun to appear elsewhere here in Canada, including a private cloud platform for a consortium of post-secondary institutions in Nova Scotia, which will drive analytics curriculum, research and development.
Join Mark Daley in a panel discussion here Friday, Nov. 29, 12:00 p.m. EST to find out more about applying cloud and analytics to accelerate research.
Our team’s work involves real-time analytics on imaging data of human brains. To illustrate how we do this, imagine that for each region of the brain we draw a circle and label it with the name of the region.
We can see brain regions “communicating” by using functional Magnetic Resonance Imaging (fMRI), which shows us which areas of the brain are “working hard” at a particular moment in time.
Mark Daley, Daley is Associate Professor & SHARCNET Research Chair at Western University
If two brain regions appear to be “communicating” at some point, we draw a link connecting these two circles. This structure is called a network and can tell us a great deal about the relationships between brain regions. We can construct a network for each moment of time during a scan, providing a unique moment-by-moment view of the communication structure of the brain.
For each of these networks, there exist many metrics we can apply to give us quantitative answers to questions such as: How well-connected is this network overall? Are there any particular brain regions that have a really important position in this network? Most importantly, we can watch how the answers to these questions evolve over time. An important benefit of the ability to distil complex topological properties of a network down to a handful of numbers is that it enables us to quickly compare the data from individuals to those taken from a “normal” population. Much as we plot a child’s height and weight development compared to “normal” children, we will be able to compare brain network scores of individuals and potentially identify pathologies of brain networks.
An important target application for our research is the ability to assist in the diagnosis of neuropsychiatric disorders. Current approaches to network-based analyses of fMRI data are time-consuming and involve significant human intervention after the scanning of the patient is complete. In some cases, when the results become available days later, the conclusion is that the stimulation protocol used on the patient did not provide conclusive results and the patient must return for another scan.
With our system, clinicians and researchers can have immediate feedback on their stimulation protocols and, if something is not working, can move to “plan B” immediately, while the patient is still in the scanner, eliminating the need for time-consuming and expensive rescans.
To cope with the volume and speed of the neuroimaging data, we have built our network-analysis pipeline on top of the IBM InfoSphere Streams platform, running on an IBM cloud provided by SOSCIP. InfoSphere Streams is specifically designed to deal with real-time data and allowed us to rapidly implement an analysis pipeline which is highly scalable; if we need more resolution in our networks, we can simply add more processors from the cloud.
To see an example of our pipeline in action using pre-recorded and pre-processed data (this is what my brain looks like when I’m in the scanner worrying about whether or not our pipeline will work), point your browser to: http://daleylab.org/lab/brain/.
Join me in a panel discussion here Friday, November 29, 12:00 p.m. EST, to find out more about how IBM, in collaboration with governments and more than a dozen leading Canadian universities are collaborating to apply cloud and analytics technologies to accelerate research, nurture “economy of tomorrow” skills and drive innovation. Post your questions on Twitter using #Convo4Change, or DM @smarterplanetca
______________________________
Mark Daley is Associate Professor & SHARCNET Research Chair at Western University working closely on this project with a team including Jinyun Chen, Rhodri Cusack, and Jinhui Qin.
______________________________
Follow IBM Smarter Planet on Google+
Continue reading:
Turning Big Data into Fast Data to Speed Brain Research A Smarter …

