
Two Stock Market Charts – Business Insider
JPM
We recently posted the latest slide deck from JPMorgan Asset Management, which has a number of charts relating to both the market and the economy. It’s a useful thing to flip through as Q2 gets under way.
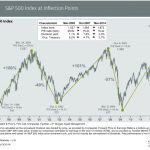
Two charts really stand out, as it pertains to the market. The above charts shows the S&P going back to 1997, and if you look at this chart it’s easy to get freaked out. The stock market seems to move in these decisive waves. Up sharply, down sharply, up sharply, etc. We seem due for a down wave. Actually we seem due for a REALLY BIG down save, because the current trend is now deviating from the norm quite severely.
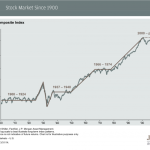
Now here’s the second chart. It’s also of the S&P 500. It just goes back a little further.
JPM
Here the story looks totally different. Going back over a century the pattern seems to be: sideways, then huge up move. And we’ve repeated that a few times.
Taken in this context, the market doesn’t look “stretched” outside of some historical range. It looks like it’s about to break out of a long period of no improvement and head for what could be an extremely long and big rally.
Of course, neither of the above patterns could be the true useful guide. Maybe the stock market will be flat for another decade. Who knows. But it’s clear that a change in perspective can dramatically change the story of the chart.
SEE ALSO:
JPMorgan’s complete guide to the US market
View article –
Two Stock Market Charts – Business Insider
See which stocks are being affected by Social Media

