
US OIL Elliott Wave Technical Analysis by Lara – 28th January, 2014 …
Last analysis of US Oil on 17th December, 2013 expected more upwards movement towards a target at 103.21 to 104.42. Price moved higher as expected, but fell short of the target reaching only to 100.76.
The wave count remains the same.
Click on the charts below to enlarge.
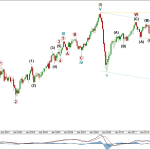
The bigger picture sees US Oil in a large second wave correction at super cycle degree. Second waves can and often do correct to very deep degrees. They may correct up to 100% the length of the first wave.
Super cycle wave II looks to be unfolding as a zigzag. Within it cycle wave a subdivides as a five wave impulse so the correction cannot be over there. Cycle wave b may not move beyond the start of cycle wave a. This wave count is invalidated with movement above 146.73.
Cycle wave b is now a complete double zigzag structure, which is atypical in that the second zigzag did not make a new price extreme beyond the first. However, that is how it subdivides.
Cycle wave c cannot reach equality with cycle wave a as that would take price below zero. Cycle wave c is unlikely to be only 0.618 the length of cycle wave a because that would see it truncated. The best way to calculate a downwards target for this wave would be to use the primary degree waves within it. I cannot do that until primary wave 4 is over.
A channel drawn about this downwards zigzag may show where it ends.
Cycle wave c is extremely likely to make a new low below 32.70 to avoid a truncation. Cycle wave c should last from one to several years. It may be either a simple impulse or an ending diagonal.
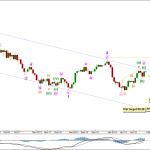
Minor wave 3 has most likely begun and is most likely extending. When third waves extend they usually clearly show their subdivisions on the daily chart. So far this wave count has a typical look.
I have drawn an acceleration channel about minor waves 1 and 2. I would expect minute wave ii to find resistance at the upper edge of this channel. It may move very slightly higher, but it should not breach the upper edge of the channel. Minor wave 3 should breach the lower edge of this channel.
In the first instance I would want to see movement below the small parallel channel about the upwards wave of minute wave ii before I have confidence that this correction is over and the next wave down is underway.
If minute wave ii is over here then at 82.26 minute wave iii would reach 1.618 the length of minute wave i.
The targets for minor wave 3 remain the same. At 80.28 minor wave 3 would reach 1.618 the length of minor wave 1. If price continues through this first target, or if when it is reached the structure is incomplete, then the second target is at 67.62 where minor wave 3 would reach 2.618 the length of minor wave 1.
Minute wave ii may move beyond the start of minute wave i. This wave count is invalidated with movement above 100.76.
Original post:
US OIL Elliott Wave Technical Analysis by Lara – 28th January, 2014 …
See which stocks are being affected by Social Media

