
Warning: Weak Stock Market Closes Are On the Rise | Zero Hedge
For weeks, months, and even years now, 330RAMP CAPITAL (the ironic phrase used to indicate the oh-so-visible hand of ‘someone’ that decides te last 30 minutes of the US trading day is the perfect liquidity time to slam VIX lower and panic-buy stocks). However, as Gavekal notes, recently we have seen an increasing number of weak-ish stock market closes.
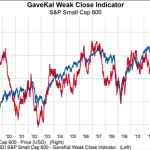
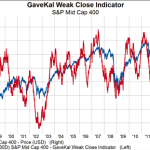
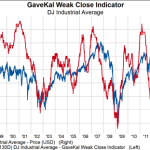
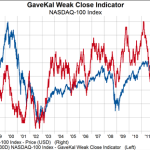
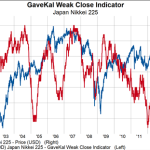
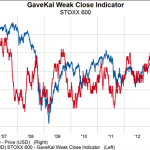
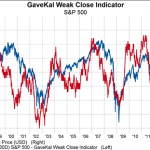
We’ve taken note of an increasing number of weak-ish stock market closes and decided to build an indicator to measure the number of weak closes and compare it to stock prices. The indicator counts the number of times over the last six months in which stocks closed in the bottom quartile of their daily trading range.
For example, if the S&P 500 trades in a 20 point range during the day and closes 4 points from the low, we would count that as a weak close.
Generally, we see the number of weak closes decline during rallies and expand during selloffs, which makes sense.
The indicator usually follows stock prices except at major turning points when it sometimes leads stocks in one direction or the other.
We mention this because we are currently seeing a rather large divergence between the weak close indicator and stock prices.
The indicator has been heading lower since the middle of 2013 while stock prices have continued their upward march. The divergence is prominent for the US and Japanese indices, but less so for the STOXX 600. Note that in the charts below the weak close indicator is plotted on the left axis and it is inverted.
Average:
4
Your rating: None Average: 4 (4 votes)
See original article:
Warning: Weak Stock Market Closes Are On the Rise | Zero Hedge
See which stocks are being affected by Social Media

