
Weekly Technical Analysis – “S&P500 1850 Remains The Target …
Its that time of the week for the usual Swiss team’s run through. The headline is they maintain that any near term weakness is corrective in nature and part of a year end push higher.
This report is a bit thinner than usual but this fits with the theme of being patient for our year end Christmas present of a higher high in equity indexes.
They sight the cyclicals as the key beta performers and likely Finance, Tech and Housing within this.
To add a little weight to this market internal sector view, price wise, the semi conductors continue to look very strong as do the financials and industrial sector. Energy is lagging but the underlying WTI is back to nearly $100 so we should expect a bounce into year end should these oil underlying numbers sustain.
Of more note is the significant under performance of some European indexes. Italy had come off by a near -10% from her early Nov high. The UK ftse100 had lost -6% and the Spanish ibex -7%. On the plus side the UK ftse250 looks much healthier again and is approaching its year highs once more as the consumption based mini boom in the UK continues. European finance sector is down -7% from her highs. The European strategy (if there is one at all) appears to be a strong currency, tight private sector lending approach and fiscal prudence. (Its an unusual strategy in the world of fx debasement and endless liquidity programs). Nonetheless large cap Euro stocks, on a relative basis look cheap here.
Asian EM markets, as they rightly state, are looking much healthier. There is plenty of global strength occurring here and now. The Shanghai composite turning positive for the year and within striking distance of her year highs. The Hang Seng made a new year high a few days ago. Yes the Indian Sensex is making new highs as well but dollar adjusted things look rather different. Prices can always be made to rise if you are prepared to destroy your currency. Both Japan and India are good examples of this during 2013, note!
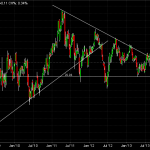
If all indexes fire together into year end it would be reasonable to expect the crb index to finally confirm the break out of her large continuation wedge pattern that she has been stuck in all year. She has a higher high and now needs to sustain some momentum to break out. If the US$ basket can sustain her recent downtrend it will become a bullish scenario for the commodities and inflation. The key question is whether we have ‘escape velocity’. If the UST breaks down and rates rise (inc key US mortgage rates) its easy to see how this threatened breakout of the commodities could die a sudden death as the US$ basket rebounds. Post YE clarity will likely emerge on these things would be my comment but for the next 3 weeks we are effectively in a window dressing “Santa” rally zone where price signals shouldn’t be taken too seriously, especially in these low volume days. In my view.
Here the commodity index:
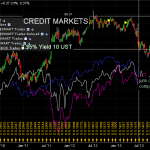
Fixed income wise the UST threatened her support meaningfully this week but has bounced off yesterday and today. She remains under pressure but no alarm bells as yet triggered.
Here the Swiss team’s latest:
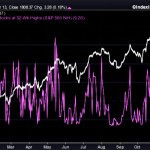
The market technical issues remain in terms of market breadth as well as investor sentiment extremes, volatility lows as well as continued declines in volumes.
A quick reminder of the market breadth weakness here below. Its not getting any better but Santa is coming ie the seasonals are very strong second half of Dec. Therefore things should hold and produce higher nominal highs for our year end numbers.
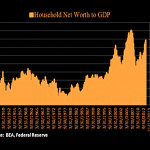
Here Yardeni’s latest:
Here more from Yardeni with some comfort for commodity speculators (and inflationists).
2013 has been a blistering year. If you are still in search of those last few percentage points there are trading candidates around at present especially in Europe, Asia having already moved in the main.
End of year aside, anyone who thinks anything has been resolved by the last 4 years of ultra easy liquidity and negative savings rates is mistaken, in my view. This has been a wonderful nominal bull market created by fiscal and monetary policy. Real incomes continue their decline as asset prices rise relentlessly upward. If only asset prices measured by fiat currencies were a real indicator of economic prosperity and health. Sadly nominal asset prices are all too easily manipulated upward in this fiat monetary system. All that has changed is their nominal number. In 2014 perhaps we discover the reality behind the mirage of recent ‘balance sheet’ wealth creation.
All the best
Rich
(
1
votes, average:
5.00
out of 5)
Loading …
Read More –
Weekly Technical Analysis – “S&P500 1850 Remains The Target …
See which stocks are being affected by Social Media

