

Weekly Technical Analysis | TheWaveTrading | Safehaven.com
Weekly Technical Analysis
By:
| Sat, Nov 9, 2013
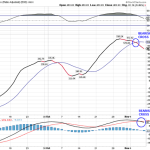
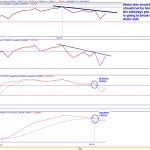
MISERABLE BREADTH
Despite Friday’s impressive recovery how can I even think to have a bullish
stance when the “trio” of swing trading indicators have a bearish cross over?
MACD has a sell signal in force since November 6. In spite of Friday’s
frenzy bullish activity the Stochastic bearish cross has not been cancelled.
The NYSE Summation Index has a bearish cross and its slope is clearly pointing
south.
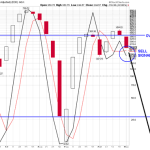
The weekly Stochastic of the Nasdaq Summation Index has issued a sell signal.
Usually a new buy signal will be issued once the stochastic drops below the
Oversold line.
SPX BPI has as well has a bearish cross and a failure to cancel it.
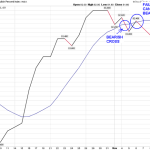
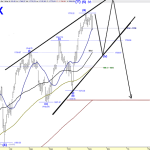
EW wise the good news is that the DOW is now probably aligned with the same
Ending Diagonal pattern that I have been suggesting for SPX.
In addition here we also know the price level that will invalidate the pattern.
Since the wave (III) cannot be larger than the wave (I), even if the wave (III)
is not in place yet, it cannot exceed 15826.59.
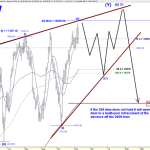
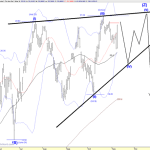
Recall that if my preferred long-term count is correct the Ending Diagonal,
if it pans out, it will conclude the Double Zig Zag from the March 2009 low
opening the door to a multi-year retracement. (If the 200 dma does not hold)
In the case of SPX keep in mind that if the ED is the correct pattern the
following wave (IV) will have to bottom below 1709.67.
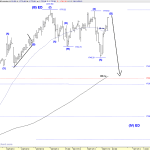
I would not rule out that XLF is also forming an Ending Diagonal. In addition
despite Friday’s huge rally I tend to believe that the wave (III) is already
in place, hence the current rebound is a wave (B) that will establish a lower
high.
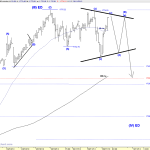
SPX short-term EWP
Due to the corrective internal structure of the decline off last Thursday’s
hod I rule out that price can establish a new ATH.
I am considering two potential patterns:
From the October 30 high price is unfolding a DZZ. If this is the correct
pattern, the up leg off last Friday’s lod is the second wave (B), which should
stall below 1774.50 Once the wave (B) is in place it will be followed by
an impulsive or Ending Diagonal wave (C) down
Price could be forming a Triangle wave (B), if the following pullback is
corrective and price maintains the sequence of higher lows and lower highs.
I maintain the following ETF:
Long SPXU stop SPX > 1776
Long QID stop NDX > 3410
Long FAZ stop XLF > 21.10
Please enable JavaScript to view the comments powered by Disqus.
Author: TheWaveTrading
Contact: If you would like to contact the author, you can e-mail him
at [email protected]
The main objective of this project is to share my views on several markets
and asset classes.
In the initial stage TWT website will be a free service.
My main focus will be the equity market with SPX being the leader but I will
also follow US equity sectors, major European indices, fixed income, currencies
and commodities markets.
My analysis is based upon traditional Technical Analysis, Elliot Wave guidelines
and investor sentiment.
My goal is to establish the most likely path that the price of a particular
asset will undertake and profit through ETF instruments both on the long and
short side and mainly with leveraged ones (2 x & 3 x).
The advantage of ETF investments is that it allows getting involved in equity
indices & sectors, currencies, fixed income, commodities etc.
Therefore the main purpose of TWT will be to establish investment strategies
regardless if the market is in an up trend or in a down trend, leveraging
the chosen scenario while managing the risk by establishing protective stop
losses.
Hence I will always define the risk, I will try to let winners run the wave
and I will cut the losses if my strategy is wrong.
Disclaimer: The content of this article is for educational purposes
only, the information supplied is not a recommendation to buy or sell any
security or financial instrument.
Thewavetrading.com nor the owner can not be held responsible for any loses
occurred from the information provided within the website.
The Information supplied cannot be copied or reproduced without the permission
from the owner.
Copyright 2011-2013 TheWaveTrading
All Images, XHTML Renderings, and Source Code Copyright © Safehaven.com
Taken from:
Weekly Technical Analysis | TheWaveTrading | Safehaven.com
See which stocks are being affected by Social Media

