
Why Am I Still In the Stock Market? | Andrew Zatlin … – Financial Sense
I’m putting my money where my mouth is. My 401K is entirely in equity market funds and stocks, and will stay there as long as I see the right signals from the economy and bond market. But make no mistake; I am getting ready to jump ship. This is really a matter of timing the market.
The Signals That Matter Right Now
“Pop quiz, hotshot. There’s a bomb on a bus. Once the bus goes 50 miles an hour, the bomb is armed. If it drops below 50, it blows up. What do you do? What do you do?”
-Dennis Hopper, “Speed”
Investing is very much like the movie “Speed“: If the economy goes too slowly, everything blows up.
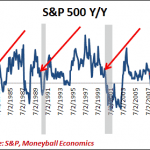
The stock market is not a leading indicator of the economy. That’s a myth. Wall Street has no special visibility into the economy. In reality, stock prices move after a company reports earnings. Bond prices move after official data gets released. Wall Street responds to economic signals as they happen, not before the fact.
“But Andrew,” you say, “look at the S&P 500 over time. The market dives months before the official start of a recession.”
True, but the recession doesn’t come out of nowhere. It’s the end result of months and months of economic flat-lining. The market is responding to some set of economic signals that say the economy has run out of steam and is actually about to contract.
Wall Street: Lagging, Not Leading
There are two basic mechanical reasons why Wall Street lags reality.
First, there’s compensation and the herd mentality. If you ever read mutual fund declarations, they always lead with comparisons to a benchmark that reflects the results of a group performance. If it’s a high tech fund, they might compare to all other funds that invest in that sector. As long as that fund outperforms the average, the fund manager wins accolades and more compensation. Outperforming the herd means taking unnecessary risks. If that means also being wrong, well, so be it. Compensation isn’t based on being right, it’s based on being just above the herd.
It’s not so much a herd mentality (a group think where everyone believes a certain thing); it’s more a herd approach (safety in numbers). The fund manager is always watching the herd and sticking close.
Second, this is data driven investing of a specific kind. Because of the herd approach, everyone relies on the same set of data to make their moves. That means that the market is trading in response to official data. Far from leading, the market is at best moving in step (coinciding) with the economy.
Since the market responds to certain data points, we want to know (1) what they are watching and (2) which data anticipate those signals.
For the next stage, we want to get out of the stock market once the economic signals point to no further growth, because the next stage is slowdown. We may be early, we may be a trifle late, but at least we will be preserving capital.
Signal #1: Jobless Claims
Initial Jobless Claims is the most reliable official economic data point. It’s accurate and, unlike every other official data point, it’s not modeled or sampled. Jobless claims are also more timely, released within mere days.
The most important metric here is my Rule of 95%.
The trick is interpreting the signal behind the jobless claims, which drop as long as the economy is expanding. Measured best on a year-over-year (Y/Y) basis, jobless claims signal economic slowdown when this year’s claims equal last year’s claims (100%). That’s when employers have reached an equilibrium point in labor and demand is about to downshift. On the other hand, as long as the economy is growing, fewer claims are filed and the ratio is <100% (fewer claims this year than last year). An economic slowdown is coming when claims hit and stay at or above 95%.</p>
That’s the Rule of 95% (my creation). Historically, every time Initial Jobless Claims hit 95%+ Y/Y for a prolonged period of time (~2 months), the US economy is 9-12 months away from a recession. This means the stock market is <6 months from contracting.</p>
For confirmation, we also want to see this ratio on the individual state level. For example, a really bad hurricane in Louisiana or a snowstorm in New York can distort the total figures. When half the states are seeing that 95% figure, it’s time to get defensive.
At this point in time, we are far from 95%, but I expect to hit it by August.
Signal #2: Big Money Moves to the Sideline
Ask any wealth manager and he or she will say the same thing: big money (and I mean really big money) focuses on wealth preservation. The same is true for institutional investors.
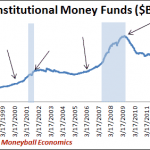
Back in the day when interest rates were 5%+, companies wanted to put their money to work overnight. A grocery store chain like Kroger’s had a lot of cash sitting around at night. Institutional Money Funds were created to enable these companies to generate extra earnings on that cash. Like a retail investor’s Money Market Fund, Institutional Money Funds preserve capital and pay a small yield. That’s exactly the goal when economic risk rises.
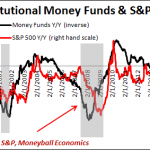
Notice in the following chart that Institutional Money flows into these funds almost a year before the recessions officially begin. Big money sees reason to be concerned, so big money starts moving to the sidelines. More importantly, the move may exacerbate the slowdown: anytime trillions of dollars are taken out of the bond and stock markets, moved to the sidelines and parked in cash, liquidity problems erupt. That hole has to be made up somehow, and fire selling begins.
This is why Institutional Money Fund flows are also a leading indicator for the stock market, as both anticipator of problems and cause. The pace of money flow is the key here, as the chart indicates.
In the chart below, I use the inverse of Money Fund flow to make the comparison easier to see. There’s an either-or dichotomy at work here: Institutional Money Funds are the opposite choice of stock market investing.
Right now, the Funds flow is signaling continued stock market support. It looks more like 2005, not 2006 or 2007. This is my signal for tracking the liquidity (monetary) impact on the stock market.
A Simple Approach
My first simple observation is that the markets respond to basic economic signals. For example, when Intel reported earnings this week, the company’s revenues stopped growing Y/Y and Intel responded by cutting CAPEX. Hiring is probably also at risk, which is why I track jobless claims (the opposite of hiring).
My second observation is that liquidity has been critical to keeping markets up. My favorite gauge of money flow is the Institutional Money Funds Index which is released frequently and almost in real-time: every week with a 2-week lag.
Once you determine which economic metrics work for you and your approach, as I have done above, then the simple task is stay vigilant, read the signs, and act accordingly. Using my indicators, I’ll be able to determine with a fair bit of accuracy when the equity markets are signaling a slowdown.
Related podcast interview:
Interview with Andrew Zatlin on Vice Index and U.S. Economy
More here:
Why Am I Still In the Stock Market? | Andrew Zatlin … – Financial Sense

