
Why you should care that Robert Prechter is warning of a 'sharp …
Who is Robert Prechter, and why should investors care that he is warning them to be on high alert for a potential collapse in the stock market?
The president of Elliott Wave International, Prechter may not be a household name on Main Street, but he’s widely known on Wall Street as the foremost authority on the Elliott Wave principle, a forecasting methodology used by generations of technical analysts that is based on the belief that financial markets trend in five waves, and retrace in three waves.
Don’t miss the slideshow: 5 charts to help unravel the Elliott Wave mystery
Prechter is also the executive director of the Socionomics Institute, founded to study how those same wave patterns define changes in social mood and govern social events.
“If the cycle is still operating, the stock market is at high risk of a sharp collapse. Near term, we’re prepared to see the Dow make one more high. But it doesn’t have to happen.”
Robert Prechter, president of Elliott Wave International
Elliott Wave analysis, which was devised by Ralph Nelson Elliott in the 1930s, is much more than a bunch of numbers and letters placed on a chart to denote which wave, or degree of waves, the market is traversing. Those who fully embrace it say it is the only form of technical analysis that can incorporate and explain all the other techniques used by chart watchers.
Walter Zimmerman, chief technical analyst at energy research firm United-ICAP, calls it the “grand unified field theory of chart pattern analysis.” Head-and-shoulders reversals, technical divergences, candlestick charts—they can all be explained within the framework of the Elliott Wave principle, Zimmerman said.
Based on Prechter’s analysis of where the stock market is positioned within its wave structure, he believes the bull market is in a “precarious position.”
For one, he said the sentiment indicators he follows have reflected extreme optimism for over two years. That is often viewed as a contrarian signal, because it suggests those looking to buy have already done so, leaving fewer buyers to step in if the market starts slipping. Read more about bullish exuberance.
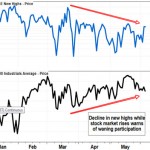
In addition, Prechter said a number of momentum indicators have been revealing a “dramatic lessening” in the number of stocks and indexes that have participated in the rally in recent months.
For example, when the Dow Jones Industrial Average DJIA, -0.36% reached a record closing high on Feb. 27, there were 172 NYSE-listed stocks that achieved new 52-week highs, and 31 stocks that hit 52-week lows. But when the Dow rose to it is latest record on May 19, the number of new highs had fallen to 118, while new lows rose to 38.
FactSet
New highs fall, while Dow rises
And while the Dow has reached six record-high closes so far this year, the Dow Jones Transportation Average DJT, -2.01% hasn’t hit a record high since Dec. 29, and closed at a seven-month low as recently as May 29. The century-old Dow Theory of market analysis suggests the Dow transports must confirm the movement of the Dow industrials for a market trend to have staying power, according to S&P Dow Jones Indices.
View this article:
Why you should care that Robert Prechter is warning of a 'sharp …

