
Morning technical analysis – 10 June 2014 | Alpari Newsroom | Live …
Morning technical analysis – 10 June 2014
June 10, 2014
by
in
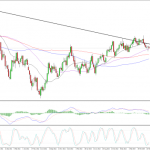
EURUSD
After seeing a lot of volatility towards the end of last week, this pair has once again stabilised around the same levels it was trading at ahead of the ECB decision. The pair is again finding support around 1.3590 and may fall back into the same range, with resistance previously being found around 1.3650. Here the 200-day SMA should provide some resistance. Despite the spike higher in the pair at the end of last week, I think it is still looking bearish, although in order to confirm this I’ll need to see a break of the 50-week SMA, which currently lies around 1.3570. The next major test below here should then come at last weeks lows around 1.35.
GBPUSD
This is currently trading at a very key level, with the daily and weekly charts not necessarily telling the same story. Ordinarily, we should pay more attention to the longer term chart, which is continuing to show the pair as being bullish. The inability to break below the 20-week SMA last week, with the level also coinciding with the 61.8 fib level – 24 March lows to 6 May highs – would suggest the 11-month long rally is still very much in tact. The 20-week SMA has been tested on a few occasions during the rally and the response at this level each time has been quite bullish. The daily chart on the other hand shows the pair breaking below a seven month trend line before coming back to test and fail to break back through here. This could be viewed as confirmation of the break which is quite a bearish signal. In order to gain any real traction again I feel we need to see one of these levels broken, otherwise we could see a slow grind higher with the pair closely tracking both the trend line and the 20-week SMA.
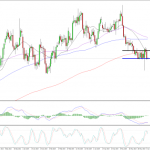
USDJPY
It may be too early to say this pair is looking bullish again following such a long period of consolidation, but there is certainly a slight bullish bias being seen in the price action right now. The 50% retracement level – 8 October lows to 2 January highs – has providing clear support for the pair over the last four months, as has the 200-day and 50-week SMAs. A key resistance level in recent months has been 102.70 and the pair is once again struggling at this level. This also now coincides with the 100% Fibonacci expansion level, with the 61.8% expansion level, and 50-period SMA on the 4-hour chart, chipping into the consolidate price action further over the last week or so. A break of either of these two levels could give a strong hint about the next move in the pair, with any move to the downside also needing to break through Friday’s lows in order to confirm the short term bearish bias.
Author: Craig Erlam
Tagged EUR/USD, Fibonacci, Fibonacci Retracement, foreign exchange trading, forex, forex uk, FX, GBP/USD, Metatrader 4, Moving Averages, MT4, MT5, Resistance, Support, USD/JPY
Continue at source:
Morning technical analysis – 10 June 2014 | Alpari Newsroom | Live …
See which stocks are being affected by Social Media

