stock-charts

What the Chinese stock market crash teach you – Get Rich Slowly

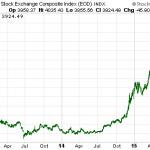
This article is by staff writer William Cowie.By some accounts, China’s stock market has been in free fall. In less than a month, the Shanghai Stock Exchange Composite Index (SSEC) — the Chinese equivalent of America’s S&P 500 stock index — saw a 30 percent drop in value.Media reports have ranged from indifference to breathless comparisons with the great stock […]

TraderFeed: Taking a Fresh Look at Stock Market Breadth

TraderFeed: Taking a Fresh Look at Stock Market Breadth

Taking a Fresh Look at Stock Market BreadthIn the last post taking a look at market breadth, in mid-February, I pointed to waning breadth but continued buying interest to suggest that we had made a momentum peak in stocks, that further price strength was likely, and that the recent rally was part […]

TraderFeed: Assessing the Recent Stock Market Strength

Stocks moved smartly to new highs in the major averages this past week. Sector rotation was particularly noteworthy, with former leaders utilities and consumer staples–defensive and yield plays–falling behind and more growth-oriented sectors–consumer discretionary and raw materials–showing particular strength. This reflects strength in U.S. economic data and an increased pricing of odds that the Fed will begin to normalize interest […]

TraderFeed: The Bollinger Balance: Tracking Stock Market Strength …

Recent posts have focused on ways of gauging broad market strength and weakness by tracking the wide range of individual stocks, rather than by relying solely upon a stock index. These market gauges include the percentage of stocks trading above their volume-weighted average prices; the upticks and downticks among all stocks trading in the U.S; and intraday new highs and […]