
7 charts that suggest the rising stock market may be wrong …
FactSet
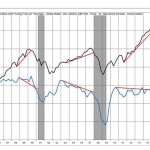
Year-over-year change in real GDP (blue) compared with S&P 500 (black)
Slide 1 of 8
If it’s all about the economy, stupid, then stock-market bulls may want to think twice about betting on further gains.
Many chart watchers say the financial markets are always right. They believe markets move before trends in fundamental data change, because market prices reflect all the information that can be known to investors, in real time, while economic and earnings data are released with a lag.
With the S&P 500 SPX, -0.03% reaching an all-time intraday high for a second straight trading session on Tuesday, that would suggest the economy’s recent struggles, as depicted by disappointing fourth-quarter growth in gross domestic product, a sharp decline in retail sales and continued weak inflation readings, will eventually give way to improving growth. Read more about recent economic data.
But as the above chart, joined by the following charts, shows, investors often ignore disappointing economic information as a bull market progresses, just as they did before the previous two recessions. And when market prices just start building rapidly on themselves, without a strong economic platform or continued stimulus from the Federal Reserve, the market bubble that is created should eventually pop.
As the saying goes, there’s nothing as bullish as a fresh record, except the last one.
Original source –
7 charts that suggest the rising stock market may be wrong …

