

Chart Learning – Learn to Trade Stocks With Technical Analysis …

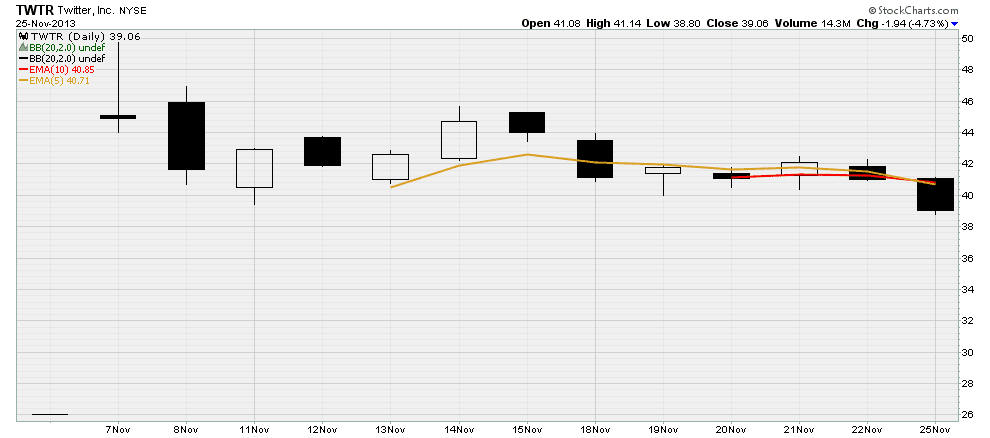
One of the best momentum indicators for going short term long is when the 5 EMA crosses over the 10 EMA. Right now $TSLA, $TWTR, $FB and $YELP are in short term downtrends, as the 5 EMA is below the 10 EMA. A good way to go long these stocks is once the 5 EMA goes above the 10 EMA (bullish crossover) it is a “safe” entry to go long. Trend traders often exit these stocks once price closes below the 5 EMA. So in other words, ride the 5 EMA up. Similarly, these stocks can be shorted when the 10 EMA crosses below the 5 EMA, and cover once price closes above the 5 EMA (I don’t like this play as much, although it already happened and has made massive profits). My friend
, plays a very successful trend strategy using the 5 EMA, you can learn more about his strategy by visiting his website. If you like this strategy, I suggest studying the Tesla chart below (left chart) to see how strong the 5 & 10 EMA crossover signal is, as well as what happens to price when the stock is below and above the 5 EMA.
View original:
Chart Learning – Learn to Trade Stocks With Technical Analysis …
See which stocks are being affected by Social Media

