
Comex Gold Futures (GC) Technical Analysis – June 16, 2014 …
Get Forex buy/sell signals directly to your email and by SMS.
August Comex Gold futures open the week nine days up from the June 3 bottom at $1240.20 and in the window of time for a potentially bearish closing price reversal top. The market is also trading inside a key retracement zone at $1274.80 to $1283.00 which means price and time are coming together. Bullish traders should be a little cautious at this time. This means watching for potential signs of a top such as an hourly closing price reversal top or an “M” top.
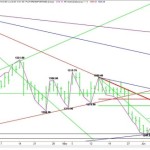
Daily August Comex Gold
Recapturing the 50% level at $1274.80 will be the first sign of strength. A sustained move over this price could lead to a rally to the Fib level at $1283.00 since there is nothing in the way to stop it. Over $1283.00 is a downtrending angle at $1287.40 and a major 50% level at $1289.60.
A failure to overcome $1274.80 will be a sign of weakness, but breaking under a major downtrending angle at $1266.00 will be the best sign of selling pressure. Given the short-term range of $1240.20 to $1278.10, its 50% level at $1259.10 is the next likely downside target.
Watch for volatility because we may be entering a news driven phase of the rally. The first $38.10 of this rally from $1240.20 may have been legitimate short-covering and some speculative counter-trend buying, but the military activity in Iraq may turn this into a news driven event.
This could mean expanded ranges and higher than normal volatility. It all depends on whether the stock markets can hold up and where the hedge funds and professional money managers decide to park their money. They could move into the U.S. Dollar, Japanese Yen or Gold.
From:
Comex Gold Futures (GC) Technical Analysis – June 16, 2014 …
See which stocks are being affected by Social Media

