
CORN ETN Technical Analysis – Potential Head And Shoulders …
CORN ETN Technical Analysis – Potential Head And Shoulders Bottom Chart Formation
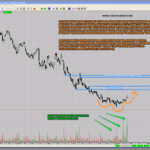
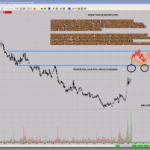
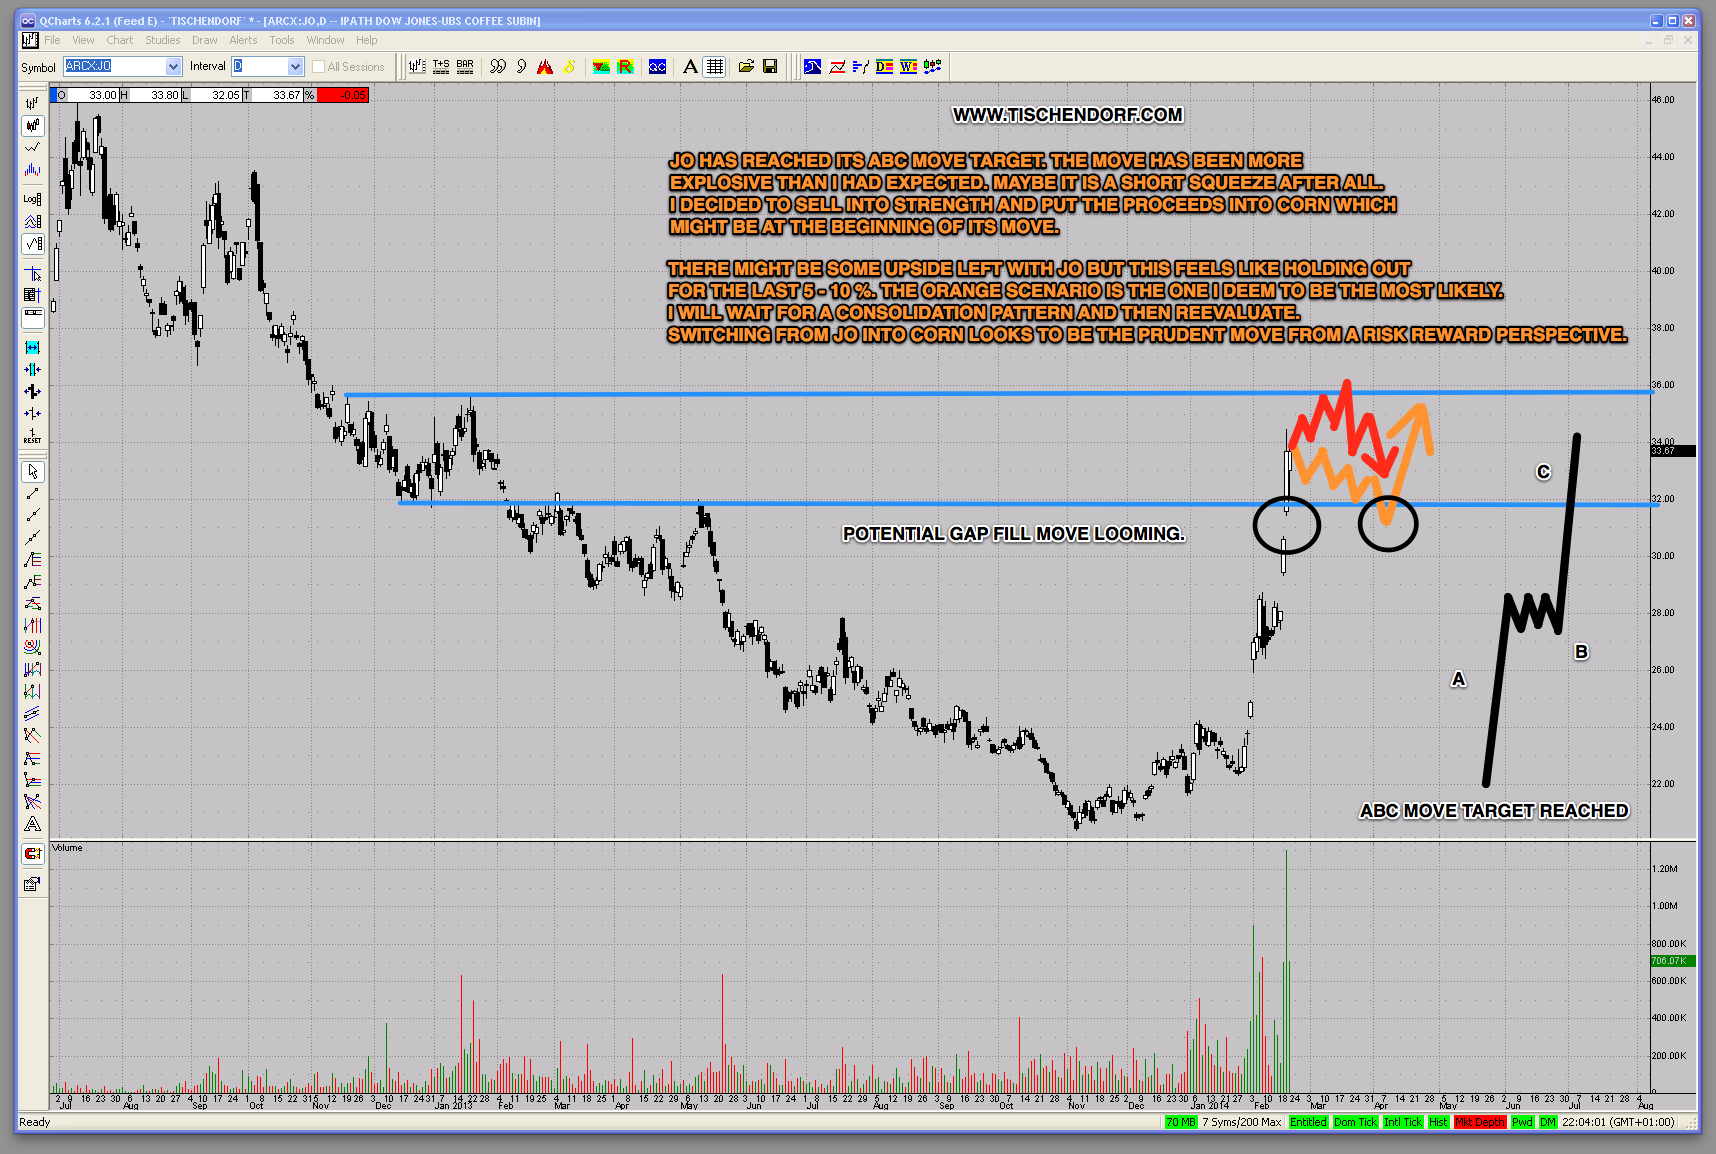
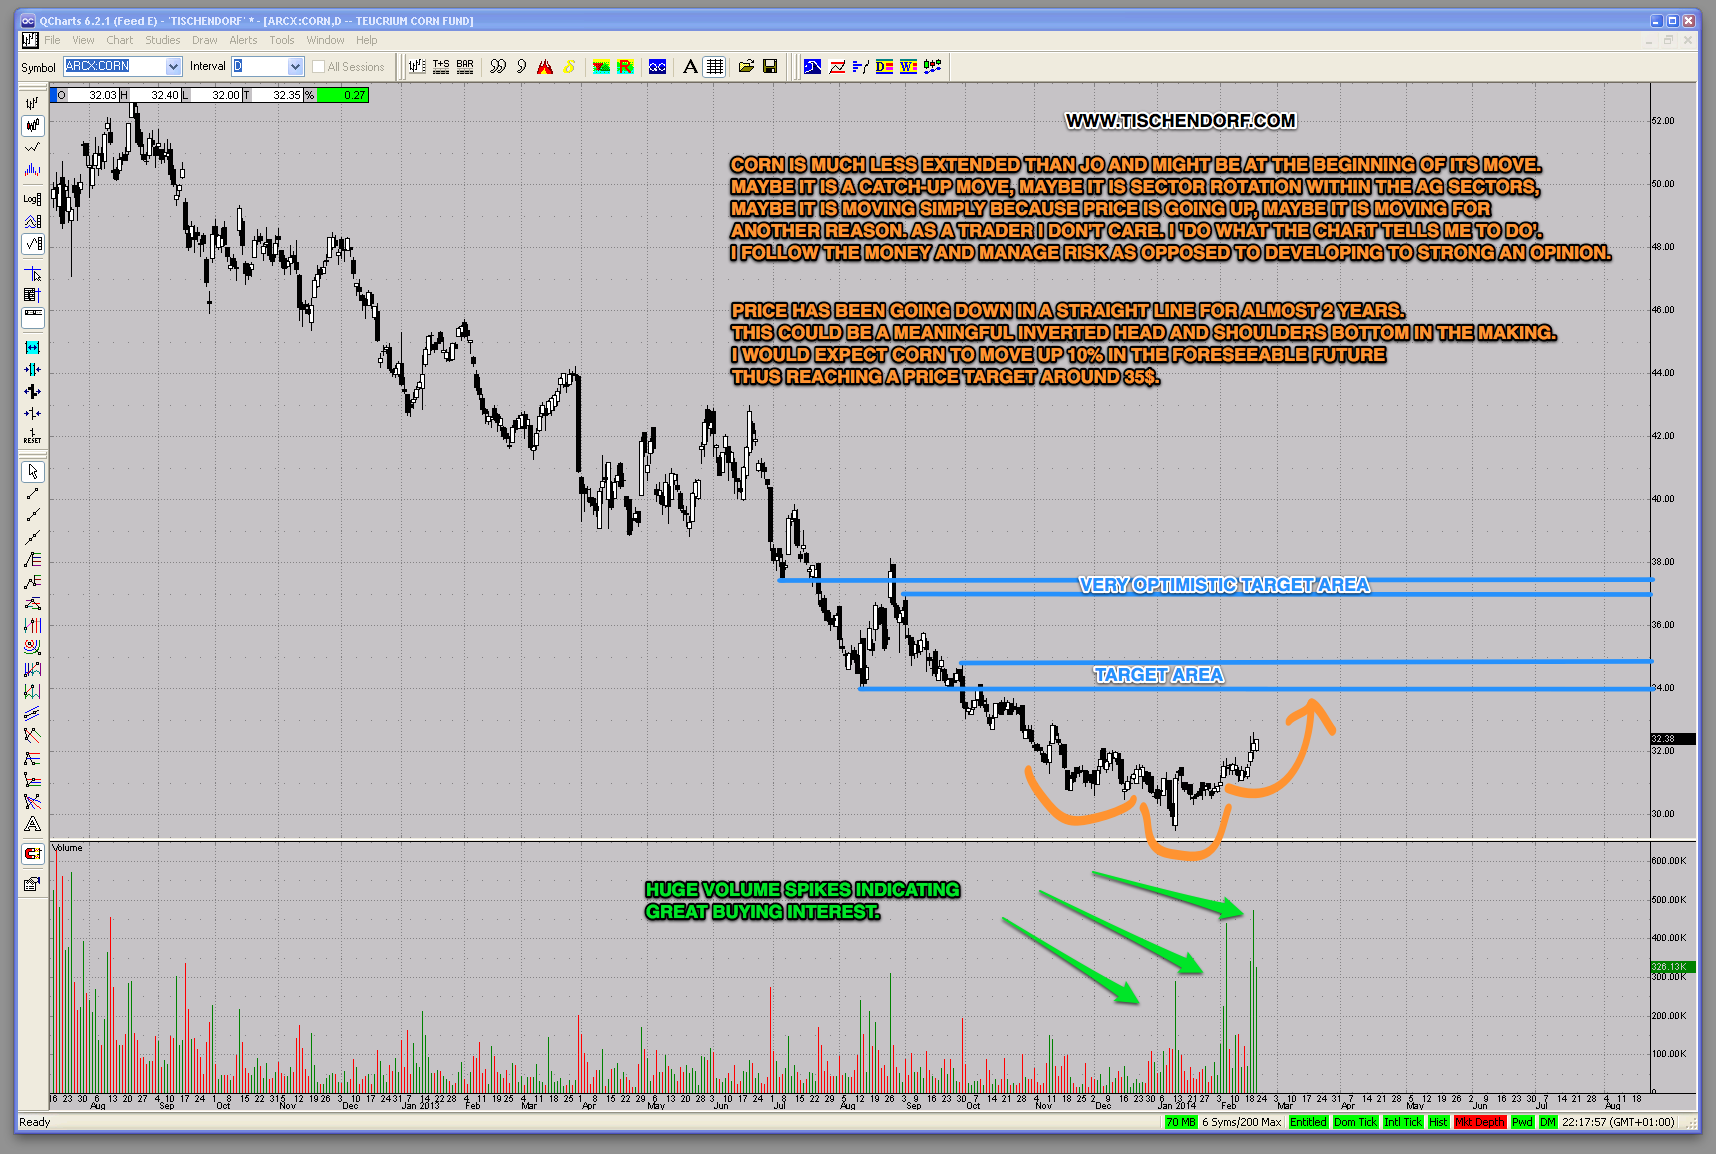
I recently went long the JO – Coffee ETN mostly because of purely technical reasons. The bullish flag chart pattern was one of the most obvious ones I came across in quite a while. Still I didn’t expect such fireworks in such a short amount of time. That being said the chart has completed a picture perfect ABC move and has reached its price target. I sold into strength because holding on to my position felt like holding out for the last 5 or 10%. Although JO could move higher still, there is no need to get greedy. I switched the proceeds into CORN – Corn ETN which is offering a fresh and potentially great low-risk set-up. CORN is not extended at all, quite to the contrary, the potential move to the upside has barely started. CORN should therefore be less prone to profit taking and pullbacks should be very mild. As always, make use of stop losses and lose your opinion if price patterns do not unfold as expected.
JO – Coffee ETN. Click the chart to enlarge:
Always up-to-date Coffee – Sector Overview Chart
CORN – Corn ETN. Click the chart to enlarge:
Always up-to-date Corn – Sector Overview Chart
My rationale for switching the JO proceeds into CORN is really simple. I am taking money out of a stock that has reached its chart formation price objective and putting it into a fresh pattern offering a lot of pattern pressure. This ensures I stay in control if the stock I am in pulls back. Remember what I said in my Audio Interview: Do what you have to do in order to be in control and then STAY in control.
I would much rather invest in a stock that’s increasing in price and take the risk it may begin to decline than invest in a stock that’s already in a decline and try to guess when it will turn around. – Richard Driehaus
Twitter: https://twitter.com/tischendorf
Stocktwits: http://stocktwits.com/Tischendorf
Charts: http://stockcharts.com/public/1109839/tenpp
Related posts:
- KGC – Kinross Gold Potential W-Bottom Chart Formation
- Various Agriculture Stocks: CORN, Coffee, BXI.TO, ANDE
- BWEN Broadwind Energy – Bullish Inverse Head And Shoulders Chart Pattern
- ENT Global Eagle Entertainment vs. GOGO Inc – Technical Analysis Comparison Charts
- Coffee ETN JO Early Signs Of Potential Trend Change
- Uranium Participation U.TO TSX Chart Analysis – Technical Price Target
Continued:
CORN ETN Technical Analysis – Potential Head And Shoulders …
See which stocks are being affected by Social Media

