
Daily Technical Analysis – 10 December 2013 | Alpari Newsroom …
Daily Technical Analysis – 10 December 2013
December 10, 2013
by
in
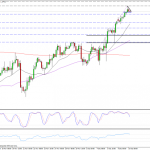
EURUSD
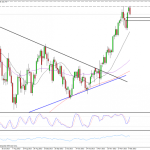
The euro is continuing to push higher against the dollar on Tuesday after recording a fifth consecutive day of gains at the start of the week. The pair is looking quite overbought now, as seen on the stochastic where it looks in the process of crossing in overbought territory. If it has in fact lost some momentum, as today’s candle suggests it may have, we could see a retracement, as we saw in the middle and at the end of November. Alternatively, given how aggressive the rally has been over the last five days, we could see a brief period of consolidation, before a continuation of the move towards 25 October highs, around 1.3830. The early signs suggest it may be the latter, with the pair finding strong support from the 20-hour SMA (middle bollinger band). This is also a previous level of resistance, which combines with the descending trend line to form a descending triangle, a bullish continuation pattern. If this is the case, the next target would be 1.3767, followed by 25 October highs of 1.3830. If we see a bigger pull back, the fib levels may be key, in particular the 50% and 61.8% retracements, with the latter falling in line with a previous level of resistance.
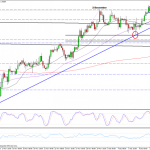
GBPUSD
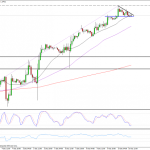
Cable is continuing to look bullish again today, after finding strong support around 1.6290 – where the ascending trend line dating back to 12 November lows intersected the 50 fib level – on Friday. It broke above last week’s highs earlier on in the session but has since lost some of the momentum. This appears to just be a period of consolidation though, with the latest price action creating a triangle formation, a bullish continuation pattern. If, as expected, we see a break above here, the next target will be today’s highs around 1.6465, followed by 1.6550, a previous level of resistance. If on the other hand it breaks below here, it could result in an inverse hammer on the daily chart, which would suggest we may see another attempt to break below the ascending trend line, dating back to 12 November lows.
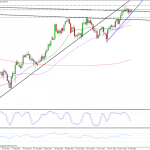
USDJPY
The dollar has turned lower against the yen today, in a move that may signal the beginning of that overdue retracement in the pair. The rally in the pair since breaking above the descending trend line on 8 November has been very strong, adding almost 500 pips in less than a month. A retracement was always likely to come, it was just a case of when. We saw a brief pull back last week before a continuation of the move higher on Friday. With the pair finding resistance around 103.35 again and looking like forming a bearish engulfing pattern, it could be about to make it’s way back towards last week’s lows, resulting in a double top formation. If this was broken, then based on the size of the double top, it should prompt a move back to around 100. For now, it will be interesting to see if this is in the early stages of a double top and the reaction to the 20-period SMA on the 4-hour chart, which is currently providing support, and the 50 and 61.8 fib levels should tell us this. If the pair respects these levels, then this could just be a longer term consolidation pattern, say an ascending triangle.
Author: Craig Erlam
Tagged EUR/USD, foreign exchange trading, forex, forex uk, FX, GBP/USD, Metatrader 4, MT4, MT5, Technical analysis, USD/JPY
Continue reading here:
Daily Technical Analysis – 10 December 2013 | Alpari Newsroom …
See which stocks are being affected by Social Media

