
E-mini Russell 2000 Index (TF) Futures Technical Analysis – June …
Get Forex buy/sell signals directly to your email and by SMS.
September E-mini Russell 2000 Index futures finished a little lower on Thursday, but remained inside a key retracement zone. How investors react to this zone should dictate today’s price action and could determine the next near-term move.
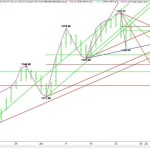
Daily September E-mini Russell 2000 Index
The short-term range is 1189.50 to 1156.40. The retracement zone formed by this range is 1173.00 to 1177.00. The market is currently probing the upper level of this range, suggesting strong buying. Taking out this level with rising volume should trigger a rally, but a series of angles in the way may prevent an acceleration to the upside.
The potential resistance angles come in at 1177.50, 1183.50 and 1187.20. The most important price level is 1183.50. This is the last true resistance before the main top at 1189.50.
A failure at 1177.00 will be the first sign of weakness. This could lead to a break into the lower or 50% level at 1173.00. A sustained move under this level could trigger a break into the nearest uptrending angle at 1167.20.
Bullish traders should focus on 1177.00. Bearish traders on 1173.00. If volume doesn’t increase on a breakout through either level, the index may trade in a four-point range.
A close under last week’s low at 1178.90 will form a weekly closing price reversal top. This could lead to further weakness next week.
More here:
E-mini Russell 2000 Index (TF) Futures Technical Analysis – June …
See which stocks are being affected by Social Media

