
E-mini S&P 500 Index (ES) Futures Technical Analysis – April 21 …
Get Forex buy/sell signals directly to your email and by SMS.
June E-mini S&P 500 Index futures are trading slightly better in the pre-market session. Traders failed to take out last week’s high at 1863.75, indicating trader indecision.
The main trend is down on the daily chart, but taking out the swing top at 1867.50 will turn the main trend to up. A failure to do so will form a potentially bearish secondary lower top and could lead to an eventual break through the April 14 bottom at 1803.25.
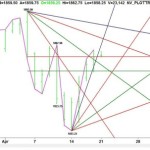
Daily June E-mini S&P 500 Index
The main range is 1892.50 to 1803.25. The retracement zone of this range is 1848.00 to 1858.50. The index is holding the Fibonacci or upper level at 1858.50, giving it a slight upside bias. A failure to hold 1858.50 will indicate the presence of sellers or the lack of buyers.
The first sign of weakness will be a move under 1858.50. Crossing over to the bearish side of a downtrending angle at 1852.50 will indicate selling pressure. Increased momentum through this angle could trigger a test of the 50% level at 1848.00. The daily chart indicates there is plenty of room to the downside if 1848.00 fails. The next potential target is an uptrending angle at 1835.25.
Holding above 1858.50 indicates that buyers are defending the low while overcoming the steep uptrending angle at 1867.25 and the main top at 1867.50 will indicate that buyers have returned. This could trigger a move to 1872.50.
The tone of the market today should be determined by how investors react to 1858.50.
Taken from:
E-mini S&P 500 Index (ES) Futures Technical Analysis – April 21 …
See which stocks are being affected by Social Media

