
E-mini S&P 500 Index (ES) Futures Technical Analysis – July 24 …
Get Forex buy/sell signals directly to your email and by SMS.
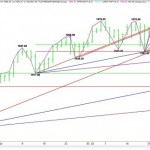
September E-mini S&P 500 Index futures found support early in the session and managed to close higher after posting a new contract high. With the index trading above the old top at 1978.25, it is important that investors come in to defend this level to sustain the move. A failure to hold this level will indicate that the rally is not being supported by new buying, but actually short-covering.
Daily September E-mini S&P 500 Index
The nearest upside target is a steep uptrending angle from the 1942.50 bottom, moving up 16 points per day. This angle comes in at 2006.50. This angle is a potential target but it is going to take some extremely high volume to drive the index into this level.
If the market does go vertical early in the session today then traders have to watch for a closing price reversal on either the hourly or daily chart to signal a short-term top.
The main support is a cluster of angles at 1975.50, 1974.50 and 1974.25. Holding above them is important to the structure of the rally. Taking out 1974.25 with conviction will indicate a shift in sentiment that could lead to a break into the next angle at 1958.50.
The E-mini S&P is still in a bullish mode, but vulnerable to a closing price reversal top. Taking out 1974.25 will also be a sign of weakness. Especially if it is accompanied by strong volume.
Look for the bullish tone to continue as long as the cluster of support at 1975.50 to 1974.25 holds. Otherwise look for the start of a decline possibly into next week’s Fed meeting.
More:
E-mini S&P 500 Index (ES) Futures Technical Analysis – July 24 …
See which stocks are being affected by Social Media

