
Is this Ashley Madison market panic?
The Trend Model is an asset allocation model which applies trend following principles based on the inputs of global stock and commodity price. In essence, it seeks to answer the question, “Is the trend in the global economy expansion (bullish) or contraction (bearish)?”
My inner trader uses the trading model component of the Trend Model seeks to answer the question, “Is the trend getting better (bullish) or worse (bearish)?” The history of actual out-of-sample (not backtested) signals of the trading model are shown by the arrows in the chart below. In addition, I have a trading account which uses the signals of the Trend Model. The last report card of that account can be found here.
on weekends and tweet any changes during the week at @humblestudent.
How deep is a pullback?
When I see headlines like this one, you know that panic is in the air at we are at or very close to a tradeable bottom.
Take a deep breath and relax. Not much has changed technically from my post published Thursday night, which summarizes my views on the latest market sell-off (see
). I won’t repeat myself, other than to outline the dilemma facing traders. On one hand, the technical structure of the US equity market looks terrible, on the other hand, the market is way oversold and sentiment is off the charts bearish, which is contrarian bullish. I resolve the conundrum with two basic scenarios:
How many ways to say “Oversold”?
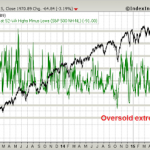
The message boards and my Twitter feed is full of stories about how oversold the market is. As an example, this chart from
shows the oversold condition of net 52-week highs-lows, an intermediate term indicator, is at an extreme.
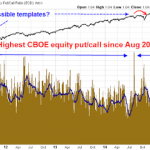
As well, the CBOE equity put/call ratio is showing a reading not seen since the bottom of the pullback in August 2014 and at the depths of the sell-off in 2011. It also offers a clue of what might happen next. Both the first sell-off in 2011 and the August 2014 decline saw three week rallies to test the old highs, followed by further market weakness.
The combination of the analysis of past Trifecta Bottom Model recoveries and the CBOE equity put/call ratio extremes suggest that a typical recovery from these oversold extremes would last 2-3 weeks.
After that bounce, we will need to evaluate the macro, fundamental and technical conditions.
Significant technical damage
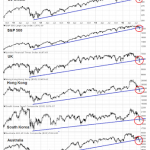
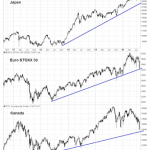
Notwithstanding any anticipated reflex rally, much technical damage has been done to both the US and foreign averages. There are broken uptrends all over the place around the world:
To be sure, there were bright spots. Some major and minor non-US indices whose technical uptrends remained intact, such as Japan, the eurozone and, to my surprise, Canada.
In search of a bearish trigger
Experienced investors know that 5-10% stock market declines happen all the time, sometimes for little or no fundamental reason. In the last couple of days, I am seeing increasingly bearish and dire forecasts coming from many chartists and traders. Regardless of the technical analytical approach taken, one basic principle that everyone can agree one that short-run stock prices are determined by supply and demand.
Here is the situation today. Right now, we are seeing a mini-panic among the fast-money hedge fund crowd, day and swing traders and the downside pressure has been exacerbated by forced selling by margin clerks and risk control officers. In order for the technical damage that we have seen to manifest itself over the coming weeks and months, the slow and big money institutions need good macro or fundamental reasons to sell stocks, which I am not seeing right now.
Consider the position of the typical institutional fund manager, who is managing tens or possibly hundreds of billions in assets. They move slowly because they take months to move in and out of positions, but once they start to move, there is size behind those flows. What would make an institutional manager de-risk and sell US stocks?
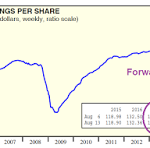
Are equity fundamentals deteriorating? Nope. Ed Yardeni shows that forward EPS estimates, which is a key measure of institutional sentiment, are rising (annotations in purple are mine).
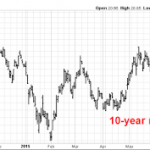
OK, if the E in the P/E ratio isn’t falling, could the P/E ratio contract and cause stock prices to fall? Nope. The discount rate is a function of interest rates and bond yields are falling, not rising.
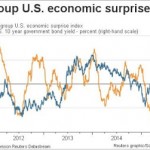
Maybe the US macro outlook is falling apart. Umm, not really. The Citigroup Economic Surprise Index has been steadily rising in the last few months, indicating that the rate of beats vs. misses in US macro data has been improving.
Another proxy for slow and patient money are corporate insiders. The weekly
Barron’s report of insider activity
shows that they have been heavily buying since mid-July.
What about China? The markets have been spooked about a slowdown in China, which has the potential to drag down global growth.
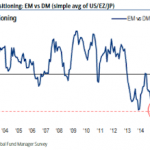
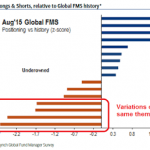
Institutional investors have already de-risked their portfolios in anticipation of a slowdown in Chinese growth. The BoAML Fund Manager Survey shows that these changes in institutional portfolio position has manifested themselves in many ways, such as managers selling down their emerging market weights to record low levels.
Global portfolios are now underweight commodities, resource sectors and emerging markets, which are all sensitive to Chinese growth.
That portfolio shift is also evident in US equity portfolios, as institutions are underweight resource sectors.
In fact, the underweight EM and resource positioning could be characterized as a crowded short. If for any reason we see a positive growth surprise or a shock-and-awe stimulus package from Beijing, we could see a melt-up in those groups as managers rush to unwind their underweight positions.
showed that monetary conditions in China are changing rapidly from tight to commemorative and therefore the chance of a positive macro surprise is rising.
To summarize, institutional managers lack a risk-off catalyst to sell stocks. The last major correction that occurred in 2011 was sparked by the combination of a budget impasse in Washington and heightened Greek tail-risk in the eurozone. Today, we have few macro and fundamental bearish catalysts. A recent must-read
summarizes how terrible things are in America (not)!
Falling oil prices = Lower input costs (oh no!)
Corporations are struggling with a mountain of cash that they don`t know what to do with (sigh)
Wage pressures are rising = High consumption (horrors!)
US housing market is on fire = More construction jobs, and so on…
This analysis suggests that once the current panic burns itself out and stock prices bounce, the bull market will continue.
Possible bearish catalysts
I would, however, like to highlight the contrary view from Jim Paulsen of Wells Capital Management. In his latest letter, Paulsen highlighted a number of risks that warrants caution on equities. He sees a number of crowded macro trades that could reverse themselves:
A crowded long in the US Dollar, which if it reversed itself, would push up inflationary expectations and bond yields (my previous post How a gold rally could derail the stock bull makes similar points);
The consensus view of dormant inflation, which, if reversed, would pressure the Fed to raise interest rates much faster than anyone expects;
An over-reliance on momentum stocks in the Consumer Discretionary and Biotech sectors;
An over-reliance on stock buybacks to boost EPS growth because in a better economic growth environment CFOs may have better use for cash other than buybacks;
An over-reliance on mergers and acquisitions to boost stock prices because in a higher growth, higher interest rate environment, high cost of capital restrains the urge to acquire; and
A sense of complacency, as evidenced by the lack of a 10% correction since 2011 and slowing price momentum.
Paulsen also worries about an aging earnings cycle:
Earnings performance is well past its best for this recovery and investors need to consider whether earnings growth will prove sufficient to support current stock market valuations. The rapidly aging earnings cycle is perhaps best illustrated by an economy nearing full employment with corporate profit margins near record highs. Should global growth remain tepid and overall sales results modest, since profit margins are unlikely to rise much, earnings trends will also likely prove disappointing. Conversely, should global growth and corporate sales results accelerate, because the U.S. is nearing full employment, companies may soon face cost-push pressures and margin erosion which will likely off set improved sales results.
Should Jim Paulsen’s bearish scenario come to fruition, then that might be the fundamental impetus for the weak intermediate term technical internals to resolve themselves to the downside. Nevertheless, his views represent a non-consensus call and these risks are unlikely to be discounted by the market in the immediate future. The next key milestone in this scenario is the September FOMC meeting. I therefore look upon his bear case as a potential setup to be realized in the weeks and months to come, not tomorrow.
The moral of this story: Don’t get overly bearish…yet.
One day at a time
In conclusion, there are few current fundamental reasons for the current pullback. China slowdown risks have largely been discounted by institutional investors.
The stock market is already seeing the terminal phase of the fast money and the margin clerks selling pressure. Once that is done, who is left to sell?
When you peel away the China headline risk, what we have left in the news is the Ashley Madison data hack, which is as sensible a reason for stock market weakness as the Ebola correction last October. Despite the negative intermediate term technical backdrop of trend breaks and negative momentum, to stay bearish now in the face of extreme oversold and crowded short sentiment conditions is to assert that, “This time is different.”
The most logical conclusion is therefore an oversold melt-up that is likely to begin in the next few days. Realize, however, that stocks may not necessarily go straight up in V-shaped recovery but instead rise and decline again to re-test the initial lows before taking off. One silver lining is that despite the market carnage on Friday, we saw minor positive divergences in RSI(5) and RSI(14) on the hourly chart.
Should stock prices stay at around Friday’s levels, my inner investor is thinking about deploying some cash into stocks as they appeared to have gone on sale for no fundamental reason.
My inner trader was unfortunately caught long in the sell-off and he is nursing his wounds. Having suffered through the pain, however, he sees no reason to change his bullish trading outlook and, in fact, he is tempted to add to his long positions at these levels. He is waiting for the bounce to see how the market behaves as stock prices strengthen after the likely two week rally that is typical of the partial two-component buy signal from the Trifecta Bottom Model. Based on that analysis, it would not be a total surprise for the SPX to recover to the 2100-2130 range.
My inner trader is also keeping in the back of his head the two scenarios outlined earlier in this post, namely the neutral to bullish one with the market resumes its trading range and possibly achieves new highs, or the more bearish one where the market corrects to new lows after an oversold rally. He plans on taking things one day at a time by watching how market internals develop in the reflex rally.
Disclosure: Long SPXL
Link to article:
Is this Ashley Madison market panic?
See which stocks are being affected by Social Media

