
Momentum Stocks Got You Down? Try A Low Risk Trade On The …
Summary
The plunge in momentum stocks has created a fresh and trade-able divergence among components of the S&P 500.
A low-risk way to play this divergence combines indices on the high beta and low volatility components versus the entire S&P 500 index.
Paying attention to the logic of the currently accepted market narratives helps prepare to make these kinds of timely trades.
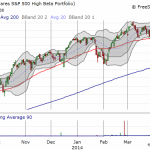
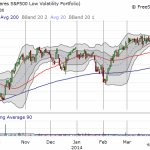
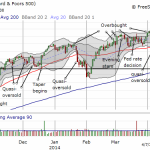
The market narrative seems to have fully accepted that momentum stocks have died (or are dying, depending on your perspective). Many former high-flyers are getting sold hand over fist with critical price levels getting violated almost without pause. The carnage in these stocks is evident in the NASDAQ (down 4.6% over the past three days and down 6.4% from its recent highs set a month ago). However the index of like-minded high beta stocks in the S&P 500, PowerShares S&P 500 High Beta (SPHB), is just two days off all-time highs. SPHB’s counterpart, PowerShares S&P 500 Low Volatility (SPLV), is also just two days off all-time highs. With these changes matching the downdraft in the S&P 500 (SPY), I was immediately reminded of the low-risk pairs trade that plays a linear combination of SPHB and SPLV off of SPY.
The NASDAQ is leading the way downward.
Even the high beta components of the S&P 500 are just two days off all-time highs.
The sell-off has barely nicked the low volatility components of the S&P 500.
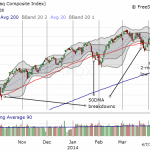
Despite all the bearish signals, the S&P 500 remains in a trading range and above its 50DMA.
Source: FreeStockCharts.com
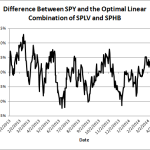
I first explained the low risk pairs trade on the S&P 500 in “A Potentially Low Risk Pairs Trade Opportunity Using The S&P 500,” I discussed the first successful test in “The Low Risk Pairs Trade On The S&P 500 Passes Its First Test.” I updated the data and model and found that the ratios continue to remain stable. Here is the chart showing the percentage difference between SPY and the optimal linear combination of SPLV and SPHB (specifically the percentage difference between SPY and 2.6 * SPLV + 3.2 * SPHB) as of Friday, April 4, 2014.
The pairs trade has returned to the top of its presumed range.
Source for price data: Yahoo Finance
Note that the percentage difference has returned toward the top of its range. Assuming that this trading range remains stable, it is time to initiate the pairs trade going long the SPLV+SPHB ratio and short SPY. I initiated the last trade at these levels; I did not initiate the reverse trade at the bottom of the range. If all goes well again, this trade should generate at least 2% in the next few months by the time it ends: either the S&P 500 will plunge faster than the linear combination SPLV and SPHB OR a recovery will ensue with SPLV and SPHB sprinting faster than the entire index.
As before, I added a kicker by choosing puts instead of shorting SPY. After investigating the changes in June put values on Monday’s sell-off I found buying two June $95 puts on ProShares Ultra S&P 500 (SSO) for every 2.6 * SPLV and 3.2 * SPHB shares closely approximated the desired trade. For those who are familiar with options, I was trying to line up “delta.” This configuration means that profits should well exceed 2% if an out-sized move ensues in the next 2+ months, especially a sell-off.
This trade is particularly attractive because the S&P 500 has demonstrated relative strength to the NASDAQ. This creates the tension that should fuel a subsequent phase of buying/selling that equals the intensity of the current angst. A sharp reaction seems highly likely because the fall in momentum stocks is running on the same machinery that sent them sky-high: either buyers will rush in to fill the vacuum because these stocks suddenly seem cheap enough to take another shot or a complete rush for the exits will occur as the market narrative concludes some kind of top in the market is unfolding.
It is interesting to see how the narrative shifts to fit the market mood. When momentum names were unstoppable, the narrative molded to the action and rationalized that investors were paying up for strong growth. Since nothing fundamental has changed to explain the sudden plunges, the narrative remolds to fit what is happening: suddenly, investors and traders no longer want to pay up. A Reuters article from April 4th titled “Momentum names may see more pain” is a classic example of this process of molding narratives to follow the market action.
The first paragraph plunges right into the supposed explanation:
“After their worst week in several years, high-flying stocks that defied gravity throughout 2013 look like they’re in for more punishment. The reason: Despite the plunge, they still look overvalued.”
In a later section called “Oversupply,” we are told: “Since stocks like Netflix carry valuations far above most of the market, some investors are reluctant to buy them now.”
These claims of course beg the question: if these stocks are still overvalued after this sell-off, and given the stock prices are lower than when investors were eagerly buying, why were investors buying them in the first place? The article gives no direct answer, but the implicit explanation comes from the quotes of several analysts. Basically, these stocks are falling out of favor because, well, because they are falling.
From Mike O’Rourke, chief market strategist at JonesTrading: “There’s value somewhere, but since these things aren’t being traded off typical valuations, you can’t go by those metrics, and it’s more about when do you find that stability.”
From Kim Forrest, senior equity research analyst at Fort Pitt Capital Group: “For momentum stocks to work, you need people to believe they can go higher.”
The ultimate irony is that Friday’s big sell-off came on a day when the U.S. government released jobs numbers that were just as good (or bad depending on your perspective) as so many others before it:
“The declines have come at a time when investors overall are seeing a general improvement in economic figures, including Friday’s nonfarm payrolls data, which showed strong job gains in March and more people moving into the labor force.”
While the bearish signals I pointed out earlier have almost all converged in agreement, this is not likely the time to finally chase stocks downward. Expectations for some kind of oversold bounce seem pretty strong…at least judging from a mainstream outlet like CNBC. Fading rallies, even intraday, seems to be the best approach for bears.
For example, CNBC.com’s cover story Monday, April 8th is titled “Here’s why a momentum bounce could be looming.” The article did not provide any good rationales, but it is a catchy title that will certainly seep into the consciousness of anyone paying attention. Art Cashin also pointed out oversold conditions on CNBC in the middle of the trading session. Jim Cramer started the morning saying he would buy a few momentum names just to “try” for a bounce; he was very careful to say he is not calling a bottom here.
I like checking out Cramer in times like these because he is a great story-teller, a master of the market narrative. In Monday’s Mad Money show he weaved together a pretty good narrative for the current sell-off, one of the better ones I have seen. Interestingly, he went as far to draw parallels to the action in 2000. Because the fundamentals of the economy are good, he is looking for buying opportunities once sellers exhaust themselves (oversold anyone?). His main point is that the sell-off is about the mechanics of the market…and this can of course help explain why the technicals are working so wonderfully right now. In particular, Cramer points out that the momentum managers that have driven stocks to crazy heights have cared much more about revenue growth than earnings growth. Once their buying power runs out, momentum names lose their support. Here is his summary explanation (ex-post of course):
Too many IPOs chasing too few dollars.IPO insiders dumping more stock on the market.Novice investors descending into panic mode.
Cramer’s bottom line: until insiders stop selling and/or IPOs stop coming and/or more money comes into the market, every rally will get sold (very consistent with my trading bias for some time now). I recently pointed out a related example when recent IPO, Wix.com (WIX), announced it would withdraw a share offering from insiders due to “adverse market conditions.”
Narratives do not need to predict the future, just provide sufficient explanatory power for what is actually happening. For example, Cramer’s narrative makes sense now that a sell-off is underway. Many would have dismissed it just a few months ago. In other words, it seems likely the narrative will play out at some point, but the timing is next to impossible to nail down. Once the signals appear to line up, as they seemed to do starting in mid-March, it helps to have a framework ready to make a move while others are rushing haphazardly. The low risk pairs trade seems to be one of those frameworks worth putting into play in the middle of the reverse momentum.
Be careful out there!
Source:
Momentum Stocks Got You Down? Try A Low-Risk Trade On The S&P 500 For A Change
Disclosure: I am long SPHB, SPLV. I wrote this article myself, and it expresses my own opinions. I am not receiving compensation for it (other than from Seeking Alpha). I have no business relationship with any company whose stock is mentioned in this article. (More…)
Additional disclosure: I am also long SSO puts.
View post:
Momentum Stocks Got You Down? Try A Low Risk Trade On The …
See which stocks are being affected by Social Media

