


Morning technical analysis – 10 February 2014 | Alpari Newsroom …

Morning technical analysis – 10 February 2014
February 10, 2014
by
in
EURUSD
The euro is looking a little more bullish against the dollar this morning, although it is still very much in a short-term downtrend as it stands. Last week was quite bullish for the pair, as you can see on the weekly, with it having produced an almost perfect marabuzo candle. There is only a tiny hint of an upper and lower shadow. Had that come in an uptrend, or closed above the previous candle, created a bullish engulfing pattern, it would have been far more bullish. Instead, we still require some form of confirmation, with the pair at least closing above the opening level from two weeks ago, or even better, breaking above the previous highs of 1.3739. If we see higher highs and higher lows being created, it would suggest we’re about to see a continuation of the longer term uptrend. That said, this may be a lot to ask, with the pair currently finding significant resistance around 1.3639, the 61.8% retracement of the move from 24 January highs to 3 February lows. The 50-day SMA is also acting as a key level of resistance around this level. If the pair does begin to edge lower from here, the next major target will be last week’s lows of 1.3476.
GBPUSD
Last week’s candle is looking quite bullish for the pound, with it having found strong support around 1.6260, where the 20-week SMA intersects the 50 fib level, before rebounding aggressively higher. That said, with the pair having made lower lows on the daily chart, we will need to see a break of 24 January highs, of 1.6667, otherwise the pair could technically be viewed as in a new downtrend. This would especially appear to be the case if the pair made new highs around 1.6459 or 1.6508. The latter, in particular, would be very bearish as this is where the ascending trend line, that the pair broke below on 31 January, intersects the 61.8 fib level, 24 January highs to 5 February lows. Not only would this suggest that the bullish move over the last couple of sessions is just a retracement, it would also act as confirmation of the initial break below which is a very bearish signal.
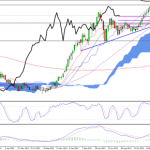
USDJPY
As you can see on both the daily and weekly charts below, the dollar is still in a very clear long term uptrend against the yen. This was confirmed, to an extent, last week by the pairs inability to break below the cloud, instead rebounding higher having also found support from the 50 fib level. Had we seen a break below, we would have still sought confirmation of the trend change from the lagging line, but as it turned out, this was not necessary. With the previous support, around 101.75, providing no significant resistance for the pair, it is now looking much more bullish again. All we really need to confirm this is for it to record new highs and new lows, which means it breaking above 103.44, previous high. The weekly chart has also looked a lot more bullish over the last couple of weeks, but has needed confirmation, which is still required in the form of a break above the inverse hammer from a couple of weeks ago. The inverse hammer itself, along with last week’s hammer, are good signals that we’ve seen a bullish reversal, but on their own are not quite enough.
Author: Craig Erlam
Tagged EUR/USD, Fibonacci, foreign exchange trading, forex, forex uk, FX, GBP/USD, Ichimoku Kinko Hyo, Metatrader 4, Moving Averages, MT4, MT5, Technical analysis, USD/JPY
From:
Morning technical analysis – 10 February 2014 | Alpari Newsroom …
See which stocks are being affected by Social Media

