
Morning technical analysis – 15 May 2014 | Alpari Newsroom | Live …
Morning technical analysis – 15 May 2014
May 15, 2014
by
in
EURUSD
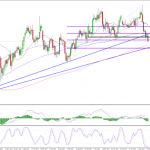
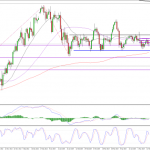
The sell-off in the euro may have only just begun, despite having fallen more than 3 cents against the dollar (300 pips) since failing to break 1.40 a week ago. Yesterday’s gains appear to have been nothing more than a brief period of consolidation, with the triangle that formed being a bearish continuation pattern. The break below this has sent the pair through the neckline of the double top that formed over the last few months, which based on the size on the formation could prompt a move towards 1.34, a level that would coincide with the 200-week SMA. It is worth noting that only a close below the neckline would confirm the break but given that the pair is currently trading almost 40 pips below it, this looks quite likely. Potential support could be found below here around 1.3640, previous low, 1.3620, 200-day SMA, and 1.36, ascending trend trend line and 76.4% retracement level – 3 February lows to 8 May highs.
GBPUSD
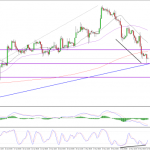
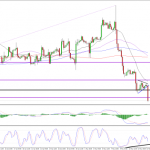
The sterling sell-off is continuing again today, as it looks to record a sixth day of losses in the last seven. While that may happen, I do have doubts about whether the sell-off will continue much below the current level. The pair has already struggled to break below 1.6730, with the ascending trend line – which dates back to 12 November – combining with the 50 fib level – 23 March lows to 6 May highs – to provide significant support. The 50-day SMA just below here is also likely to provide solid support for the pair. Should this level hold, it would be quite a bullish signal and suggest the uptrend is still firmly in tact. A break of it could point to a much bigger correction, with the next big test coming around 1.6667, the 61.8 fib level.
USDJPY
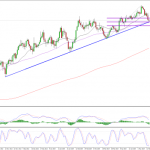
The dollar is continuing to trade in a fairly tight range against the yen, with 102.70 capping any moves to the upside and 101.30 propping it up. Over the last couple of weeks, the pair hasn’t even reached these boundaries with the range appearing to have tightened further. This may suggest that this consolidation period may be a little more prolonged than previously thought. That said, the failure to break above the 61.8 fib level a couple of days ago could suggest that the bias is leaning towards the downside. Of course we’ll need to see confirmation of this with a daily close below 101.30.
Author: Craig Erlam
Tagged EUR/USD, Fibonacci, Fibonacci Retracement, forex, forex uk, FX, GBP/USD, Metatrader 4, MT4, MT5, Resistance, Support, Technical analysis, Trend line, USD/JPY
See more here:
Morning technical analysis – 15 May 2014 | Alpari Newsroom | Live …
See which stocks are being affected by Social Media

