
Oil, Interest Rates, And The U.S. Stock Market | Seeking Alpha
Summary
I examine the impact of lower oil prices and low interest rates on the US stock market.
I argue how both are important measures to examine closely together.
I show that low oil and interest rates are bullish for the US stock market in the short and medium term.
There exists two economies, the real and financial economy. What is the most important input for the real economy? An input that if taken away the real economy would collapse. The answer is of course oil. Oil is the most important determinant that keeps the modern world going. What is the most important input to keep the financial economy going? An input that if taken away would lead to a collapse of the financial economy. The answer is debt. Debt is the underpinning of the monetary system. Both oil and debt crises have driven the financial markets into near collapse.
The main point here is that the prices of these two inputs, thereby tell us a lot. My exercise is to understand how the current drop in oil prices in a low interest environment may impact the future US stock market.
The process I use is based on analyzing historical data. Of course I must express that history is not always the best guide to predict the future.
My analysis contains two steps. First, I determine the points in history where a low oil price/interest rate environment occurred. Second, I determine the performance of the US stock market from the first date the low oil/interest rate period was detected.
To start, I calculate a ten year moving average for the price of a barrel of oil and the ten year US treasury yield. I determine a low oil price/interest rate environment if both the current oil price and interest rate are concurrently one standard deviation below their ten year moving average. I then calculate the stock market return from that date to the highest price before correcting.
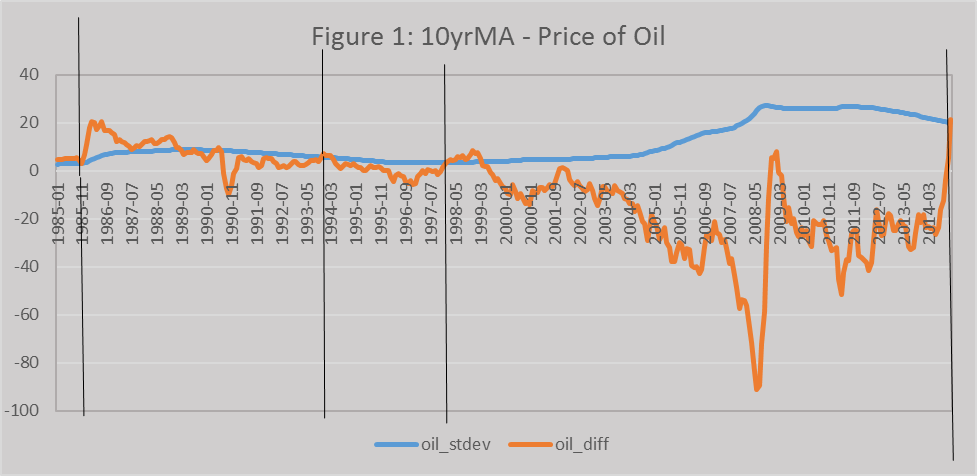
Below are two figures. Figure 1 displays two lines. The first line is the difference between the 10 year moving average and the current price of oil. The second line is the standard deviation of the price of oil over the past ten years. If the difference passes the standard deviation it signals a drop in oil has occurred and a switch between a high oil price to low oil price environment. The vertical line highlights the date in which oil fell considerably from its ten year moving average. Those dates include:
- 10/1985
- 1/1994
- 2/1998
- 12/2014
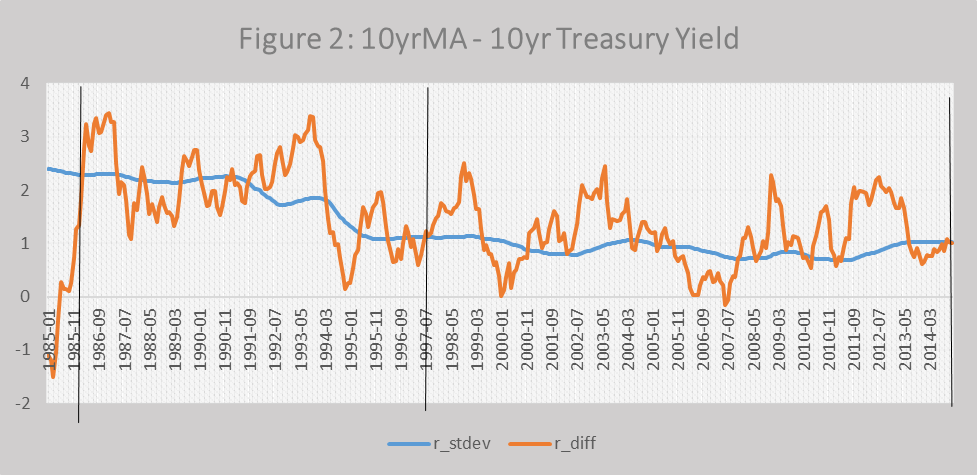
Figure 2 displays the same graph but for the ten year Treasury yield. When the difference between the 10 year moving average and the current ten year Treasury yield increases above the one standard deviation it signals a low interest rate environment. There are many different periods from 1985 to 2014 that are determined low interest rate environments. The vertical line signals the periods where there existed a low interest rate environment at the same time as a low oil price environment. Those periods included:
- 10/1985
- 2/1998
- 12/2014
The first step is completed. I determined the dates in history where both the price of oil and interest rates were concurrently low relative to the past. Our next exercise is to determine the performance of the S&P 500 starting from those dates.
From 10/1985 to 08/1987 the S&P 500 increased from 189 to 330, resulting in a 75% return over an almost two year period.
From 2 /1998 to 8/2000 the S&P 500 increased from 1050 to 1517, resulting in a 45% return over an almost two year period.
After those large run ups the S&P 500 then decreased substantially.
As of December 2014 we have just entered a low oil price/interest rate state. Therefore, solely based on the above analysis, I expect the US stock market to produce a large return over the next one to three years and then correct. Of course this analysis has limitations. There exists only two data points and we are using history to predict the future. Nevertheless, the theory of why I am performing this analysis I believe holds some merit. The prices of the two most important inputs of the real and financial economy are both low. This provides tremendous benefit to both the US consumer and producer.
In conclusion, adding our historical analysis on top of macroeconomic theory we believe the US stock market still has a lot of room to increase over the medium term. If today resembles anything from the 1987 and 2000 the S&P 500 should fall at least 30%. I am not suggesting to time the market. However, I believe a good strategy is to remain long the US stock market and slowly reduce exposure little by little as the US stock market increases. Good ideas to invest in the US stock market include SPY. In addition, small cap companies will also benefit from the fall in the price of oil. Small cap had under performed. Therefore, ETFs such as VB offer potential smart investments.
Source:
Oil, Interest Rates, And The U.S. Stock Market
Disclosure: The author is long VB. The author wrote this article themselves, and it expresses their own opinions. The author is not receiving compensation for it (other than from Seeking Alpha). The author has no business relationship with any company whose stock is mentioned in this article. (More…)
Visit site:
Oil, Interest Rates, And The U.S. Stock Market | Seeking Alpha

