
Robert Shiller's revered stock market valuation … – Business Insider
More Charts
Stock prices relative to earnings are very expensive. This is reflected by the high price-earnings (PE) ratio.
One closely-followed version of the PE ratio is Robert Shiller’s cyclically-adjusted price-earnings (CAPE) ratio, which is calculated by taking the S&P 500 and dividing it by the average of ten years worth of earnings. If the ratio is above the long-term average of around 16x, the stock market is considered expensive.
CAPE is currently at 26x, a level last seen during the dotcom bubble and, before that, the crash of 1929.
Therefore, we must be doomed, right? Not necessarily.
“The so-called CAPE, popularized by Professor Shiller of Yale is extended but unfortunately has no ability to predict stock price outcomes a year later,” Citi’s Tobias Levkovich said on Friday. “Yet, that does not seem to confound the bears, which we find both intriguing and revealing about motive rather than study.”
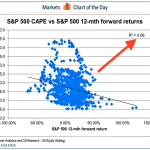
To illustrate his point, Levkovich reviewed the 12-month return of the S&P 500 after the index hit various CAPE levels in history. (See chart)
Intuitively, you’d think that a high CAPE would be followed by low or negative returns, while a low CAPE would be followed by higher positive returns. This would manifest as blue dots going from the top left to the bottom right.
By eyeballing it, it’s obvious the trend is not clear.Citi Research
Levkovich tested the relationship between CAPE and 12-month returns using R2, which reveals how well a regression line — the line of best fit you see — explains the relationship.
The R2 was a very low 0.06, indicating that there is essentially no statistically sound relationship. In other words, Robert Shiller’s revered stock market valuation ratio is crappy at predicting 12-month returns.
The thing is, Robert Shiller is aware that CAPE does a terrible job of telling traders when to buy and sell stocks. He explained to Business Insider’s Henry Blodget two years ago.
John Campbell, who’s now a professor at Harvard, and I presented our findings first to the Federal Reserve Board in 1996, and we had a regression, showing how the P/E ratio predicts returns. And we had scatter diagrams, showing 10-year subsequent returns against the CAPE, what we call the cyclically adjusted price earnings ratio. And that had a pretty good fit. So I think the bottom line that we were giving – and maybe we didn’t stress or emphasize it enough – was that it’s continual. It’s not a timing mechanism, it doesn’t tell you – and I had the same mistake in my mind, to some extent — wait until it goes all the way down to a P/E of 7, or something.
In other words, don’t dump stocks and hide in cash because the CAPE is at 26. Rather, just be prepared lower average returns for years to come.
Ultimately, a PE ratio is just not a good tool for predicting 12-month returns. Having said, it’s probably best not to play the game of predicting 12-month returns.
NOW WATCH: Nationwide’s Super Bowl commercial about dead children is about corporate profits … in a way that we can all appreciate
Please enable Javascript to watch this video
View post:
Robert Shiller's revered stock market valuation … – Business Insider

