

SPX: Weekly Technical Analysis | TheWaveTrading | Safehaven.com
SPX: Weekly Technical Analysis
By:
| Sun, Feb 9, 2014
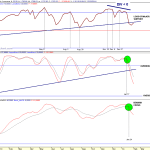
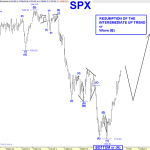
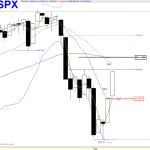
From the November 2012 low, fourth time, the 27-week ma has acted as support
preventing a larger decline.
As well the weekly hammer with the low of the tail at the 0.5 retracement
of the advance from the October low is suggesting that at least the corrective
down leg from the December 31 peak is over.
Even though it is premature to conclude that the correction is over (price
could still be unfolding a Zig Zag hence this advance would be the wave B which
will establish a lower high), if bulls are able to overcome the hurdle located
in the range 1813.50-1815.55 then odds would favour the resumption of the intermediate
up trend.
We have several bullish “signs” that are suggesting that price has established
a new swing low:
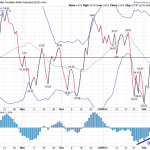
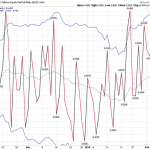
Last week the SPX % of stocks trading above the 50 dma dropped to an oversold
level where a bottom can be established.
10 dma of the NYSE Adv-Dec Volume also dropped to the oversold line where
usually a bottom can be established.
Breadth thrust of the McClellan Oscillator which reached an oversold reading
and was displaying a positive divergence of its MACD histogram as well as
a positive divergence of the Oscillator last Tuesday when SPX made an intraday
lower low. Going forward if the McClellan Oscillator remains above the zero
line it will favour the bulls.
The NYSE Advance-Decline Line has issued a bullish cross.
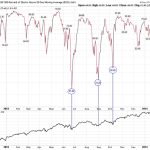
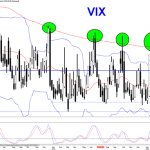
VIX has fallen sharply (Weekly Shooting Star). As we can see in the weekly
chart below this is the fourth time since December 2012 that a spike above
the 200 wma has been followed by a fierce collapse below the 20 wma while
the 15.80 area has acted as support/resistance. Therefore if SPX has established
a new swing low we need to see VIX falling below the 20 wma which today stands
at 14.22
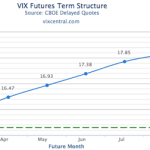
VIX term structure in contango with spot below near term future contracts
is suggesting a lower volatility environment.
So we have bottom signals but no guarantee yet that the up trend has resumed.
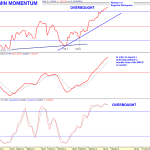
As a matter of fact weekly momentum remains a major concern:
RSI displayed a negative divergence at the SPX December 31 high and it
has lost a major trend line support.
The Stochastic has lost the 80 line but is has not entered yet the oversold
zone.
The MACD on January 24 has rolled down issuing a sell signal.
And the weekly Stochastic of the Summation Index after issuing a sell signal
in January, it has not reached yet the oversold zone where usually it recycles
back up.
Since we are still faced with uncertainties I will adopt a day-by-day strategy.
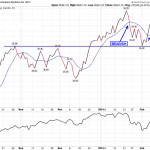
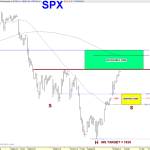
If the assumption that price has concluded a corrective down leg off the December
31 peak is correct (Double Zig Zag) it is reasonable to expect at least a 3-wave
up leg from the February 5 low therefore eventually we should see a pullback
followed by another up leg:
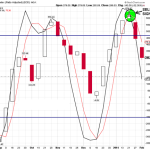
If the first up leg has ended at Friday’s hod and the following corrective
pullback finds a bottom in the range 1777 – 1768 then we would have the best
bullish scenario with a potential Inverted Head & Shoulder. If this pattern
pans out the theoretical target is located at 1859 (New ATH)
If instead next Monday we have more follow through to the upside this up leg
should top in the range 1811 (200 hma) – 1815. 50 (Horizontal resistance)
The high reading of CPCE may favour it.
Once this up leg is in place if the following pullback is corrective it will
give us clues regarding the scenario of the new “Swing low” since given the
size of the first up leg it would be reasonable to expect a new ATH with the
assumed second up leg.
60 min. momentum is stretched (The absence of negative divergence of the RSI
is suggesting that odds favour the scenario of at least a 3-wave up leg).
In the daily chart we can see that price has retraced 50% of the corrective
decline from the December 31 high. In order to increase the odds that correction
is over Friday’s gap at 1773.43 must not be closed and bulls must overcome
the 50 dma, which stands at 1809.
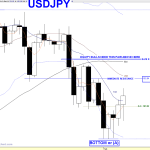
Lastly but not less important we will have to monitor USDJPY since a weak
Yen has been one of the main drivers of higher stock markets. Even if the down
leg from the January 2 high is corrective as long as this pair does not recover
above 103.64 the risk is tilted to the down side. If the correlation is maintained
another down leg of this pair will most likely kill the SPX bullish scenario.
Please enable JavaScript to view the comments powered by Disqus.
Author: TheWaveTrading
Contact: If you would like to contact the author, you can e-mail him
at [email protected]
The main objective of this project is to share my views on several markets
and asset classes.
In the initial stage TWT website will be a free service.
My main focus will be the equity market with SPX being the leader but I will
also follow US equity sectors, major European indices, fixed income, currencies
and commodities markets.
My analysis is based upon traditional Technical Analysis, Elliot Wave guidelines
and investor sentiment.
My goal is to establish the most likely path that the price of a particular
asset will undertake and profit through ETF instruments both on the long and
short side and mainly with leveraged ones (2 x & 3 x).
The advantage of ETF investments is that it allows getting involved in equity
indices & sectors, currencies, fixed income, commodities etc.
Therefore the main purpose of TWT will be to establish investment strategies
regardless if the market is in an up trend or in a down trend, leveraging
the chosen scenario while managing the risk by establishing protective stop
losses.
Hence I will always define the risk, I will try to let winners run the wave
and I will cut the losses if my strategy is wrong.
Disclaimer: The content of this article is for educational purposes
only, the information supplied is not a recommendation to buy or sell any
security or financial instrument.
Thewavetrading.com nor the owner can not be held responsible for any loses
occurred from the information provided within the website.
The Information supplied cannot be copied or reproduced without the permission
from the owner.
Copyright 2011-2014 TheWaveTrading
All Images, XHTML Renderings, and Source Code Copyright © Safehaven.com
Follow this link:
SPX: Weekly Technical Analysis | TheWaveTrading | Safehaven.com
See which stocks are being affected by Social Media

