
Stock Market At Key Decision Point – Where to From Here? | John …
The following is an excerpt from the US Stock Market section of the Keys To This Week report, which also covers US Stock Market Sectors, US Interest Rates, the US Dollar, and economically influential commodities like copper, gold and crude oil. Keys To This Week, one of 8 reports that Asbury Research produces throughout the month, provides a strategic macro outlook for the US financial landscape that looks 1-2 quarters out, and includes specific tactical investment ideas.
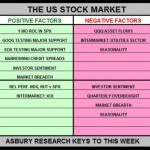
Our table below still retains the prior week’s Positive alignment of key Near Term market factors for the US stock market, and the past month’s Negative Intermediate Term bias. The key takeaway is that this is a near term decision point for the US stock market from which technology and small cap stocks must lead the next leg higher, if there is going to be one. Look for the market’s next leg higher, or a corrective decline, to begin from right here. On the plus side we have two market leaders, Google Inc. (GOOG) and the PHLX Semiconductor (SOX) Index, both testing major underlying support levels amid bullish investor sentiment and market breadth data, plus ideal conditions for upcoming relative outperformance by both the NASDAQ 100 and Russell 2000. If the current 2013 US market advance is still healthy and intact, these conditions should result in the aggressive resumption of that larger trend in the near future.
[Listen to: Jim O’Sullivan: Things Are Better Than You Expect]
Bigger picture, however, a list of market factors including a flattening yield curve, declining long-term interest rates, more intermediate term-oriented investor sentiment and market breadth data, our expectations for continued relative outperformance by the Utilities Sector, and 56 years of seasonality data collectively warn that any rebound that emerges from here is likely to eventually lead into a meaningful (more than the 5-6% we have seen so far) US broad market correction, probably during the 3rd Quarter.
Table 1 — Listed in the order of their importance and expected impact on market direction
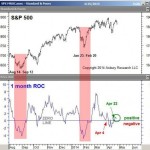
1.) Momentum: Monthly Rate of Change (ROC), S&P 500. NEAR TERM BULLISH. The red arrow in Chart 1 below points out that the S&P 500’s 1-month rate-of-change (ROC), (the percentage change between the most recent price and the price 21 day ago) turned back to positive (bullish) on April 22nd, from negative on April 4th. This metric indicates that the February US broad market advance has resumed following a brief April pullback.
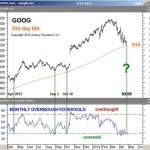
2.) Key Stocks: Google (GOOG). MAJOR DECISION POINT, NEAR TO INTERMEDIATE TERM BULLISH. Chart 2 below plots GOOG daily over the past year and shows that the Tech bellwether is currently testing major underlying support at its $516 per share 200-day moving average while monthly oversold (lower panel, according to a 21-day Relative Strength Index). The green vertical highlights between both panels show that previous instances of this have coincided with the stock’s past three near term bottoms. Therefore, we will view GOOG’s reaction to $516 this week as an indication of whether its July 2012 major uptrend is still valid and intact and, more broadly, as an indication of whether major uptrends in the positively correlated S&P 500 (SPX) and Dow Industrials (DJIA) are still intact.
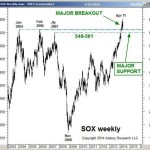
3.) Support/Resistance: PHLX Semiconductor (SOX) Index. MAJOR DECISION POINT, TURNING NEAR TO INTERMEDIATE TERM BULLISH. Chart 3 below shows that the SOX broke out above major overhead resistance at its 2004, 2006, and 2007 benchmark highs at 549 to 561 in early March, and has most recently backed up to test this former overhead resistance area as underlying support. The index traded as low as 559 between April 11th and 15th, which is where its larger 2008 advance should resume if still valid. The SOX’s next overhead obstacle is 12% above the market at 642. (See our April 24th US Financial Market Chart Book for more charts and detail on this.).
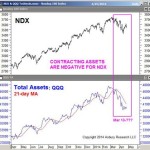
4.) ETF Asset Flows: PowerShares QQQ ETF. NEAR TERM BEARISH. Chart 4 below shows that the daily total assets invested in QQQ contracted below their 21-day (monthly, red line) moving average on March 13th and have remained there since, and that this has coincided with the current decline in the NASDAQ 100 (NDX). Although these assets have stabilized over the past week or so, they must expand back above their monthly moving average to indicate that there is enough new buying pressure to support another price advance.
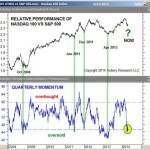
5.) Relative Performance: NASDAQ 100 (NDX) and Russell 2000 (RUT) Indexes. MAJOR DECISION POINT, NEAR TO INTERMEDIATE TERM BULLISH. The black line in the upper panel of Chart 5 below plots the daily relative performance of the NASDAQ 100 (NDX) versus the S&P 500 since 2008, with quarterly overbought and oversold extremes by NDX versus SPX plotted by the blue line in the lower panel. The highlighted area in the lower right edge of the chart shows that the NASDAQ 100 is currently at quarterly oversold extremes versus the benchmark, while the green vertical highlights between both panels show that previous instances of this have coincided with the past four minor outperformance trends by the NDX during this period. Since Technology typically leads the US broad market both higher and lower, how NDX responds to this relative oversold extreme this time will be seen as an indirect indication of whether or not the US broad market resumes its current uptrend, or begins a corrective decline.
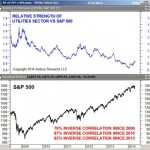
6.) Intermarket Relationships: The Utilities Sector. NEAR TO INTERMEDIATE TERM BEARISH. Chart 6 below shows that the relative performance of the Utilities Sector versus the S&P 500 (blue line, upper panel) is inversely correlated to the S&P 500 itself, which means that investors typically migrate into defensive Utilities when the US stock market is declining. Per the correlation, we view our trend model’s February 4th overweight in the Utilities Sector (Utilities have outperformed the S&P 500 by 4% since then) as being indirectly near to intermediate term bearish for US equities.
7.) Credit Spreads: Corporate Bond Spreads. NEAR TERM BULLISH. No change from last week. Through the end of last week, both BAA and Hi-Yield Corporate Bond Spreads continue to reside near historic narrow extremes that indicate little to credit or repayment risk according to the bond market. It would take appreciable widening in these spreads to indicate that there is enough apprehension/fear in the marketplace to help facilitate and sustain a US stock market correction.
8.) Investor Sentiment: NEAR TERM BULLISH, INTERMEDIATE TERM BEARISH. 3 of the 18 investor sentiment metrics that we track continue to indicate favorable conditions for last week’s US stock market rebound to continue on a near term, week-to-week basis. However, the majority of these metrics suggest that the US stock market is in the early stages of an emerging corrective decline that could potentially extend through the 2nd Quarter.
9.) Overbought/Oversold: Major US Stock Indexes. INTERMEDIATE TERM BEARISH. Through Friday, all major US indexes remain are in the process of working off early April intermediate term (quarterly) overbought conditions and thus are vulnerable to more weakness between now and the end of the 2nd Quarter.
10.) Market Breadth: NASDAQ 100 (NDX), Russell 2000 (RUT). NEAR TERM BULLISH,INTERMEDIATE TERM BEARISH. Chart 5 of our April 21st Keys To This Week showed that the percentage of Russell 2000 constituent stocks trading above their 50-day moving average was rebounding from near 20%, a level that had coincided with important bottoms in the small cap index on April 15th and during November and June 2012. This metric continues to suggest that RUT, and the NASDAQ 100 as shown in our April 14th report, are amid favorable conditions for another similarly important rebound now.
11.) Intermarket Analysis. AMEX Oil Index (XOI). INTERMEDIATE TERM BULLISH. As we have displayed and discussed throughout much of 2013, XOI is in the midst of a major bullish trend that targets an eventual, additional 7% rise to 1700 that will remain valid above critical underlying support at 1240. XOI finished last week at 15904. Considering the tight and stable positive correlation between XOI and the S&P 500 over the past 20 years, an upcoming 7% advance in the former indirectly suggests the likelihood of a coincident, similar advance in the US broad market index.
12.) Seasonality: NEAR TO INTERMEDIATE TERM BEARISH. May is the 5th seasonally weakest month of the year in the S&P 500 since 1957. It represents a strong one-month seasonal setback from April, the 2nd strongest month, and the beginning of a sustained period of seasonal weakness that culminates in September. More charts and detail on annual, quarterly and monthly seasonal trends in 17 global asset prices including equities, benchmark interest rates, foreign exchange, and key commodity prices based on historical data going back to the 1950s, is available in our April Global Seasonal Analysis report.
For further information, including a sample copy of the entire report, contact us at sales @ asburyreearch.com or by calling 1-888-960-0005.
Asbury Research subscribers can view the most recent May 5th issue of Keys To This Week by logging into our Research Center.
Originally posted here:
Stock Market At Key Decision Point – Where to From Here? | John …
See which stocks are being affected by Social Media

