


Technical analysis of USD/CAD for Febuary 20, 2014 – MT5

Technical analysis of USD/CAD for Febuary 20, 2014
General overview for 20/02/2014 11:10 CET
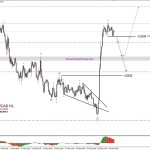
Five impulsive waves to the downside has been finished and now the first leg of the corrective cycle is in progress. Judging by the shape of the correction, it looks like a ZigZag pattern and the key level to the upside here is at the level of 1.1024. Any breakout lower would make this corrective cycle more complex and time consuming. The first upside target is at the level of 1.1121.
Support/Resistance:
1.1121- Target for wave c green
1.1088 – Technical Resistance
1.1063 – Intraday Support
1.1051 – WR1
1.1024 – Key Level
1.0994 – Weekly Pivot
Trading recommendations:
The downside break out below the level of 1.1063 means short positions should be opened with SL above the level of 1.1093 and TP at the level of 1.1024.
Show full picturePerformed by
analytical expert: Sebastian SeligaInstaForex Group © 2007-2014
Published:
2014-02-20 11:19:45 UTC+00 2 days, 22 hours, 40 min. ago
Recommend: Forex Analytics
▶
Technical analysis of EUR/USD for February 21, 2014
2014-02-21 04:35:29 UTC+00 2 days, 5 hours, 24 min. ago
Views today
1118
▶
Technical analysis of gold for February 21, 2014
2014-02-21 02:56:36 UTC+00 2 days, 7 hours, 3 min. ago
Views today
910
▶
Gold analysis for February 21, 2014
2014-02-21 13:24:57 UTC+00 1 day, 20 hours, 35 min. ago
Views today
934
▶
Elliott Wave analysis of AUD/USD for February 21, 2014
2014-02-21 14:59:14 UTC+00 1 day, 19 hours ago
Views today
842
▶
Elliott wave analysis of EUR/NZD for February 21, 2014
2014-02-21 09:23:40 UTC+00 2 days, 36 min. ago
Views today
882
See the original post:
Technical analysis of USD/CAD for Febuary 20, 2014 – MT5
See which stocks are being affected by Social Media

