
The Diverging U.S. Stock Market | timiacono.com
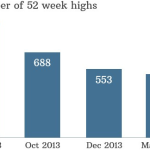
This CNN/Money story about how a peak in the number of new highs for individual stocks (as shown below) consistently spells trouble for broad equity market indexes almost a year later is probably of little concern to those who bid share prices higher in recent days as all major U.S. stock indexes turned in big gains this week after last week’s tumble.
Ned Davis Research looked at 15 stock market highs since 1962 and says the peak in new highs for individual stocks precedes the peak in the overall markets by 9 to 11 months.
If that holds true this time around, we’re about done with the bull run.
We’re 11 months past the May 2013 peak of new highs in individual stocks.
I recall reading about this in the wake of the early-2000s internet stock crash where some investors were able to avoid the carnage by taking note of this development before share prices reversed course.
They say what’s different this time is that stock market leaders are the first to fall (e.g., tech and biotech shares in recent weeks), however, this may well be another case where we’re in such uncharted territory (i.e., due to the mis-pricing of assets after unprecedented central bank intervention) that historical comparisons are all but meaningless.
Continued here:
The Diverging U.S. Stock Market | timiacono.com
See which stocks are being affected by Social Media

