
This Is The 'Thinnest' New High In Stock Market History | Zero Hedge
When we posted yesterday’s piece on the stock market’s weak internals (If Beauty’s On The Inside, This Market Wins The Ugly Contest), we weren’t sure if things could get any worse – and by how much – with the major averages still able to hold near 52-week highs. Well, the answers were “yes” and “a lot”. In yesterday’s piece, we noted that Friday produced one of the ugliest “Up” days in memory, based on the internals. Again, the internals, as represented by indicators like advance-decline breadth, advance-decline volume and new highs-new lows, are a gauge of the health of the broad stock market. This health can differ, sometimes significantly, from the market’s appearance from merely watching the major averages (e.g., the S&P 500 and Nasdaq Composite, etc.) We like to see strong internals as an indication of a healthy market. When a rally “thins”, i.e., the internals weaken, it can be a sign of vulnerability for the broad market, even with the major averages at their highs.
Well, we can say with confidence that yesterday, July 20, 2015, was the thinnest new high on record in the U.S. stock market (while the Nasdaq Composite closed at a new high, we are taking some license with here with the S&P 500 as it closed up to within 0.12% of it 52-week high).
Here is our evidence (all data from Reuters):
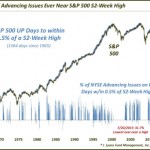
1.) Yesterday saw the fewest % of NYSE Advancing Issues ever near an S&P 500 52-Week High
There were just 967 Advancing Issues on the NYSE yesterday versus 2086 Declining Issues. At 31.7% of issues, that is by far the lowest % of any day since 1965 that the S&P 500 closed up to within 0.5% of a 52-week high. As an FYI, there have been 1,564 such days since 1965.
2.) The past 2 days saw the lowest % of NYSE Advancing Volume ever near an S&P 500 52-Week High
Despite the higher closes in the S&P 500, the past 2 days had just 28% and 29% Advancing Volume on the NYSE. Those are, again, by far the 2 weakest readings of all the 1,564 near highs since 1965.
3.) Yesterday had the 2nd worst showing of NYSE Highs vs. New Lows ever near an S&P 500 52-Week High
There were 307 New Lows on the NYSE versus just 107 New Highs. The differential of -200, as well as the % of New Highs vs. New Lows (35%) mark nearly the worst readings on record near an S&P 500 new high. Only 3 days between December 21-28, 1999 saw worse readings among the 1,484 near highs since 1970.
4.) Yesterday saw the fewest % of Nasdaq Advancing Issues ever at a Nasdaq Composite 52-Week High
There were just 804 Advancing Issues on the Nasdaq yesterday versus 1743 Declining Issues. At 31.6% of issues, that is tied for the lowest % of Advancing Issues of any Nasdaq Composite 52-week high since 1988. Only March 14, 2012 had as low a figure among the 749 Nasdaq 52-week highs.
5.) Yesterday saw the lowest % of Nasdaq Advancing Volume ever for a Nasdaq 52-Week High
Despite the new high in the Nasdaq Composite, yesterday saw just 42% of volume on the Nasdaq go to Advancing Issues. That is the weakest reading of all the 749 Nasdaq new highs since 1988.
6.) Yesterday was just the 2nd time ever with more Nasdaq New Lows than New Highs at a Nasdaq 52-Week High
With 154 New Lows on the Nasdaq versus 107 New Highs, the differential was not quite as egregious as that on the NYSE. However, it was just the 2nd time of all 756 Nasdaq 52-week highs since 1986 that saw more New Lows than New Highs on the exchange. Only 3 days between April 5-8, 1999 also had more New Lows than Highs.
Our view of the thinning out of market breadth has been well documented. It holds potentially very negative ramifications for the broad stock market. This isn’t just a 1 or 2-day wonder either. It is a trend that has been building for about 12 months now. This development doesn’t have to be an immediate death-knell for the bull market. However, eventually it will necessarily take its toll. Considering the thin nature of recent highs, that day of reckoning would appear to be fast approaching. If this rally gets any thinner, our Candlestick charts will stop casting shadows.
Average:
5
Your rating: None Average: 5 (5 votes)
Source:
This Is The 'Thinnest' New High In Stock Market History | Zero Hedge

