
Todd Harrison: The Stock Market Flirts With A Massive Breakout …
Editor’s Note: Todd posts his vibes in real time each day on our Buzz & Banter where subscribers can follow over 30 professional traders as they share their ideas in real time. Want access to the Buzz plus unlimited market commentary? Click here to learn more about MVPRO.
Everyone and their cousin Daryl thought the market would bust a move through S&P (INDEXSP:.INX) 1850 yesterday and register a fresh breakout to all-time highs. All session, wire to wire, we saw 3:1 positive breadth, broad leadership, and heck — they were trading above the all-important technical zone.
So what shot did the market up and pull? It heaped supply on the tape starting at high noon and eventually broke it back below the Maginot line into the close. That price action left the anticipatory players — all the traders who got on board the Acne Express — long inventory . . . sans their catalyst.
As of this post, the S&P remains several handles below technical validation (and for many, breakeven on their purchases), which makes today’s action of particular interest.
If the bulls can rally their troops and recapture the flag, it will be game-on in Matador City. If they can’t — if the market continues to trade below S&P 1850 — we’ll have the recipe for an offsides by wrong-footed traders on today of all days, Turnaround Tuesday.
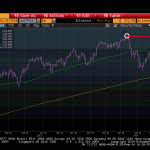
Why is S&P 1850 so important? Closing above that level would trigger an inverse head & shoulders pattern that “works,” through a pure technical lens, toward the S&P 1960s.
And how do we get that groovy target? You take the “shoulder” minus the “head,” and add the difference back to the “shoulder.” Or, in this case, 1850 minus 1740 (110), added back to 1850, arrives at 1960ish.
Technical analysis is one of four primary metrics — fundamentals, structural, psychology are the others — but should the tape close above S&P 1850 and remain there, that’s what the charts are telling us.
And yes, every technician is watching this, so there’s that. The path of maximum frustration rarely rewards the consensus, or at least it rarely used to.
Random Thoughts
Watch the banks. BKX (INDEXSP:BKX) 71.50 is the technical level of lore, but a positive tone would go a long way to achieving the above bullet.
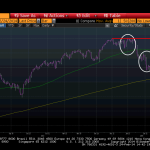
We flagged the Russell 2000 (INDEXRUSSELL:RUT) yesterday as it attempted to push through the all-time high. Sure enough, the bears defended that level, creating a potentially bearish double top. RUT 1182ish is the level to watch, per the chart below.
I learned a long time ago to “let your first sale be your worst sale,” and it’s served me in good stead.
Twitter (NYSE:TWTR) acted funky all session yesterday and continues to underperform today. I don’t have a story, but I have my eyes.
We like to watch the high beta realm as a harbinger for risk appetites, if not “speculative excess.” A quick sniff of the price action today finds the animal spirits alive and well, thank you very much. Tesla (TSLA) up $30 (15%), Linkedin (LNKD) up $11 (5.5%), Netflix (NFLX) up $10 (2.2%), Priceline up $40 (3.1%), Amazon up $9 (2.5%). Indeed, I’m having a bit of a deja vu moment circa 2000, but that doesn’t mean it can’t continue. I’m reminded of JDS Uniphase; which kept going and going and going….until it didn’t.
If faith and trust are the foundational constructs of exchange, Bitcoin has a steep slope ahead of it. I’ll be debating the pros and cons of this cryptocurrency on a MarketWatch panel on March 4 in NYC; if you have an interest in attending, please email [email protected] by Friday, Feb. 28.
R.P.
Twitter: @todd_harrison
Follow Todd and over 30 professional traders as they share their ideas in real-time with a FREE 14 day trial to Buzz & Banter.
See original article here:
Todd Harrison: The Stock Market Flirts With A Massive Breakout …
See which stocks are being affected by Social Media

