
Verint Systems Inc. (VRNT): Verint Systems: Big Data Analytics …
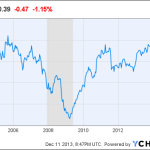
Verint Systems, Inc. (VRNT), the software applications provider, is up 39% year-to-date. The share price formed a base above $25 during 2011 and 2012 and is now heading towards the $50 level. Verint is in the Enterprise Intelligence and Communications Intelligence business, Big Data.
Unlike its peer, Splunk Inc (SPLK), Verint is priced reasonably. I estimate that it is trading at 20 times trailing adjusted earnings. Unadjusted, Verint is trading at just below 40 times earnings, which compares to the Russell 2000’s P/E of 33.
That said, I’m bullish on the industry and bullish on the fundamentals of this business. My 52-week price target is $50 per share; this would mean that Verint would trade at about 22.7 times earnings. The key risk would be financial underperformance; I’m expecting 8% diluted EPS growth during fiscal 2015.
Fundamentals
For those of you who are unfamiliar with Verint, it provides Actionable Intelligence solutions. The company makes Big Data actionable through the ability to capture, analyze and act on large volumes of rich, complex, and often underused information sources, such as voice, video, and unstructured text. Verint does this through its portfolio of Enterprise Intelligence Solutions and Security Intelligence Solutions. Clients include 80 percent of the Fortune 100.
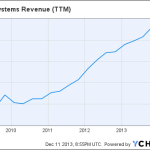
Revenues are generated from products, and support and service with support and service comprising the majority of revenues. Let’s say that $500M of revenues comes from Enterprise Intelligence and just over $250M of revenue comes from Communications Intelligence. Roughly $100M of revenues comes from Video Intelligence. Communications Intelligence is the percentage growth segment.
TTM) Chart”/>
VRNT Revenue (TTM) data by YCharts
Profits are the reason we invest. Verint is still in its growth phase; such being the case, I will exempt the enterprise from my usual “lack of return on capital” penalty. This is because Verint is showing improving profitability as it gains scale. Revenues could reach $1B annually in fiscal 2015 or 2016. I can see net income in the low-to-mid teens. This means that my outlook for return on equity is favorable for the valuation.
Solvency analysis can be critical for investment performance. At the end of the fiscal third quarter, the financial leverage ratio was 2.93, which is bordering on excessive. This is down from fiscal 2013 levels following an increase in additional paid-in capital; the solvency is heading in the right direction. Net debt is reported as $268 million for the end of the third quarter. Long term debt is associated with the 2013 Amended Credit Agreement which has an effective interest rate of 4.23%.
Free cash flow is a key metric. And Verint is free cash flow positive with FCF growing to $154 million during the trailing twelve months from $103 million during fiscal 2013. FCF was $90M in fiscal 2012. FCF increased 71% from fiscal 2012 to the trailing twelve months.
There are some significant risks, besides the usual risks, that are worth discussing. A significant portion of revenues comes from government contracts; in some cases, government can be more price sensitive than enterprise. Additionally, management is pursuing a growth through acquisition strategy which comes with risks. There will always be risks; overall, I’m bullish on the industry and business.
Valuation
Non-GAAP diluted EPS forecasts for Verint are available; consequently, I’m going to utilize the non-GAAP measure in the valuation. On a price to GAAP diluted earnings per share basis, Verint is trading at 38.19; on a price to non-GAAP diluted EPS basis, Verint is trading at 14.34. This represents a 166% difference in valuation.
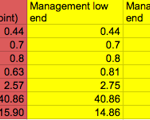
I’m going to use the fiscal year definition of forward multiplier model valuation. For fiscal year 2014, Verint is trading between 14.6 and 14.9 times earnings. Adjusting the earnings forecast, Verint is trading between 13.7 and 15.9 times fiscal 2014 earnings. The average EPS estimate is $0.87 and the mid-point of management’s guidance is $0.835. The high end of my valuation implies $1.04 diluted non-GAAP EPS in the fiscal fourth quarter.
With the average estimate suggesting a 4.4% non-GAAP EPS decline, there is potential for earnings to beat the consensus expectation, which would result in a valuation closer to 14 times earnings. I estimate that Verint is trading at 13.6 times fiscal 2015 earnings.
The interpretation of the valuation depends on which EPS figure that you use. From an unadjusted GAAP diluted EPS prospective, Verint looks expensive, but from a non-GAAP diluted EPS prospective, Verint looks cheap. When I adjust GAAP diluted EPS for the poor performance in 2014’s first fiscal quarter, Verint is undervalued; I think that it is trading at about 20 times TTM adjusted diluted EPS while the Russell 2000 trades at 32.6 times earnings.
Thus, my 52-week price target of $50 per share would result in a P/E of 22.71, which I do not view as expensive.
Source:
Verint Systems: Big Data Analytics Provider Trading At Reasonable Valuation
Disclosure: I have no positions in any stocks mentioned, and no plans to initiate any positions within the next 72 hours. I wrote this article myself, and it expresses my own opinions. I am not receiving compensation for it (other than from Seeking Alpha). I have no business relationship with any company whose stock is mentioned in this article. (More…)
Credit:
Verint Systems Inc. (VRNT): Verint Systems: Big Data Analytics …

