
Why The Downside Risks Of The Stock Market Currently Outweigh …
Summary
The S&P is currently in the midst of a tremendous five-year rally and has recently reached record highs despite a sluggish American economy and decelerating growth in corporate revenues.
There are many market indicators that suggest that the market may be nearing its peak including decelerating S&P growth, decreasing rates of capital inflow into the market, and a recent.
The stock market is also exceedingly vulnerable due to the historically low trading volume and market volatility as well as the Fed’s QE tapering strategy.
For the first time in the past five years, I Know First is forecasting that the stock market is likely to decrease in the 1-month, 3-month, and 1-year time horizons.
Though I don’t necessarily believe that there will soon be a major correction, I do believe that the downside risks of remaining heavily invested in the equity market far outweigh.
In the past five years, the S&P been growing at one of the most rapid rates in its history and hasn’t experienced any sustained corrections lasting more than a three months. This streak is especially remarkable given tepid growth in the American and global economies. And it has defied the generally accepted principles of mean reversion, historical Shiller P/E ratios, simple moving averages and the established heuristic that the frequency of corrections increases as bull markets age. The vast majority of Wall Street analysts has been forecasting such a correction and as a result has consistently failed to anticipate the record S&P 500 (SPY) gains and has on average missed the actual returns by more than 10%. Others, including Nobel Prize winning economist Robert Shiller, have even suggested that the market may have already entered bubble territory.
Why has the equity market been performing so spectacularly despite the sluggish economy? Are Wall Street’s generally accepted principles of mean reversion and average P/E ratios wrong? Is the stock market truly unpredictable? I Know First’s self-learning algorithm, which uses chaos theory to analyze the complex dynamics of the chaotic stock market, has correctly predicted the sustained bull market throughout the past five years and assured the public that 2014 would be a good year for equities in its December 2013 and January 2014 Seeking Alpha articles despite the plethora of naysayers who were forecasting significant corrections. I Know First correctly predicted the impressive gains of Alcatel-Lucent (ALU), Nokia (NOK), Alcoa (AA), and Hewlett-Packard (HPQ), while also anticipating the corrections in gold (GLD) and the Western steel industry. Of course I Know First has missed some predictions such as with Citigroup (C) and Apple (AAPL), but its portfolio strategies have significantly outperformed the S&P 500’s already stellar performance.
I Know First’s bullish S&P prediction has held true for the past few years; however, this past week its algorithm has finally begun to anticipate an S&P correction. Though I Know First isn’t necessarily forecasting a catastrophic correction, it does anticipate negative market returns in the short, medium, and long-term horizons. Perhaps this bearish prediction seems oddly timed as the stock market has been breaking historical records daily, economic indicators seem to be improving, Wall Street generally predicts sustained albeit slower economic growth, and even Wall Street’s most vocal bear, Nouriel Roubini, has become optimistic for 2014. However, there are many indicators that are hinting that the stock market isn’t as robust as it may seem. Most interestingly, the S&P is atypically increasing in tandem with U.S. treasuries – an asset that generally moves in the opposite direction and is perceived to be a safety asset. Additionally, the S&P’s trading volume is reaching five-year lows, the tech industry has already begun to experience a correction, and many hedge fund managers appear to be pulling their stakes out of the American equity markets.
It is incredibly difficult to anticipate a market correction and believers in the efficient market hypothesis even argue that doing so is impossible. Even those who believe in long-term mean reversion and those who identify reasons to believe that the current prices are unsustainable, understand the maxim that “the market can stay irrational longer than you can stay solvent.” Those who correctly identified the tech bubble in the mid 90’s missed out on the bubble’s tremendous gains, the “smartest” investors were those who pulled out right before the crash at the turn of the millennium. I do not claim to know that there will definitely be a market correction or that that the market won’t continue to add to its five-year growth; however, I do believe that the costs of currently staying invested in the stock market far outweigh the benefits.
In the generally accepted best-case scenario, the stock market has at most five percent more upward potential for the rest of 2014, but staying invested in the stock market leaves investors vulnerable to the huge downside potential that seems ever more likely. In brief, the downside risks of the stock market far outweigh its upward potential. Though shorting the market completely may prove to be incredibly lucrative, I’m not advocating that everyone should completely divest from the stock market. Rather, I recommend investors to take further efforts to hedge their portfolios against downside risk. In times of elevated uncertainty about equity prices, it is often a good idea to take some short positions preferably in laggard companies in high-growth industries, but for those who are uncomfortable taking any short positions there are other alternatives. These include shifting investments to less volatile blue chip stocks and stocks that have lower historical correlations with the rest of the market including real estate trusts and utility providers. Investors can also buy assets that are traditionally considered to be good hedges such as U.S. treasuries and precious metals. Generally, I believe that since the downside risks of remaining heavily invested in the stock market highly outweigh the potential benefits, investors should reduce their exposure to the riskiest equities.
The Current Five-Year Stock Market Rally and Analysts’ Forecasts
The stock market has increased more than 180% since its bottom in March 2009. This rally is unique due to its atypically rapid pace and its notable lack of any significant corrections. Though it is understandable why the stock market rebounded after its 50+% correction in wakes of the financial crisis and Great Recession, few if any expected it to surpass its pre-recession highs so soon.
It is inevitable that the stock market will experience a correction of significant magnitude at some point in the future, but Wall Street analysts are struggling to identify when it will occur and by how much it will do so. However, mainstream Wall Street analysts by and large predicted that 2014 would be another bumper year for equities – the mean of the top 14 analysts’ S&P price targets was 1,955 points, representing a 6% gain for the year. Perhaps they are being overly optimistic after failing to foreshadow the 2013 bumper increases in equity prices, but so far their forecasts seem to be on track. Overall, Wall Street predicted that equities levels would rise considerably in 2014 without any major corrections.
Even the more pessimistic Wall Street analysts predicted the stock market to grow in 2014. David Kostin, Goldman Sachs’ chief U.S. equity strategist, had one of the most conservative Wall Street market projections; he predicted that the S&P 500 would end the year only 2.8% higher with a 67% likelihood that the S&P would experience a 10% correction in the process. BMO analyst, Brain Belski anticipated the “markets to perform strongly during 1H (likely exceeding our year-end target) but fade during 2H, as investors grapple with the removal of QE stimulus.” Perhaps as we enter the 2nd half of the year, we will finally see some the effects of QE tapering as Belski predicts.
Though Wall Street’s major banks seem to expect sustained stock market growth in 2014, a spate of analysts has recently come out with bearish predictions. Of course there have been numerous bears throughout the five-year rally who’ve been proven terribly wrong, but it is still important to acknowledge their warnings and understand their reasons for being pessimistic. Saxo Bank’s chief economist, Steen Jakobsen expects the S&P to peak at around 1,900-1,950 points and then decrease by roughly 30% by the end of the year. He emphasizes that this isn’t necessarily an imminent threat, but still encourages investors to reduce their stakes in equities because even though “the market may have an upside of 5%” since “you’re looking at a 30% downside in the final month of 2014.” In other words, it isn’t worth taking on so much risk for so little gain. Additionally, many non-main stream analysts have been predicting major corrections. MarketWatch’s Paul Farrell argues that there is a 98% chance that the biggest market crash in 30 years will occur this year and PeakProsperity’s Chris Martenson argues that there will likely be a 60% correction due to the bursting of the triple top of the last 15 years. Robert Wiedemer, the economist who correctly anticipated the collapse of the American housing market, proposed that there is a high probability of a 90% drop in the American equity market in the near future. Though it’s noteworthy to acknowledge these naysayers’ opinions, we can’t give them too much weight because many of them have been consistently wrong for the past five years.
It is important to acknowledge both the adverse incentives of Wall Street analysts to issue optimistic forecasts and the lesser-known analysts to issue radical contrarian forecasts. Citigroup chief U.S. equity analyst Tobias Levkovich explains, “If you’re a bull and you’re wrong, you’re forgiven. If you’re a bull and you’re right, they love you. If you’re a bear and you’re right, you’re respected. If you’re a bear and you’re wrong, you’re fired.” As a result, McKinsey calculated that Wall Street forecasts have been 100% too high on average. Conversely, lesser-known analysts are incentivized to propose extreme contrarian views, no matter how unlikely, because otherwise few people would give them any attention and in the off chance that they are correct, they will be considered oracles. Billionaire investor, Warren Buffet advises investors not to attribute much weight to macro forecasts about the stock market.
Reasons to Be Pessimistic about Sustained Stock Market Growth
The Stock Market is Historically Overvalued
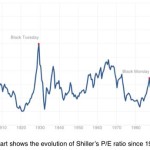
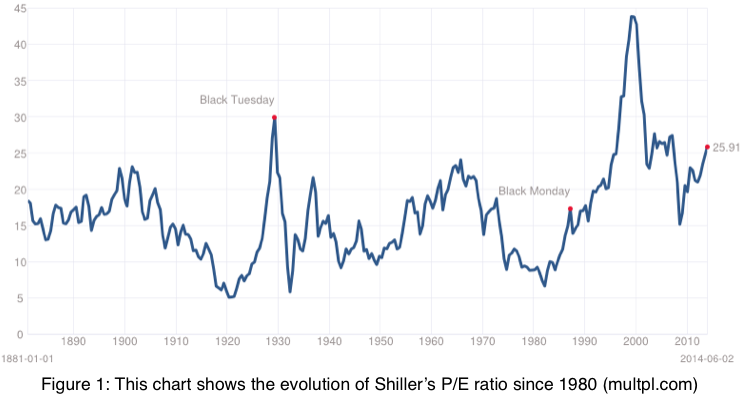
Some economists and financial analysts believe strongly that in the long run the stock market should revert to its mean Price to Earnings Ratio (P/E). The largest proponent of this valuation, Yale professor Robert Shiller, calculated that the cyclically adjusted mean for the historical P/E ratio is 16.53. Figure 1 shows the evolution of Shiller’s P/E ratio since 1980: the highest recording ratio was 44.20 in 1999 during the height of the Tech Bubble, the ratio before the financial crisis was about 28, and the ratio is currently 25.89. According to this valuation metric, it would seem that the stock market was overvalued in 2008 and is once again in overvalued territory.
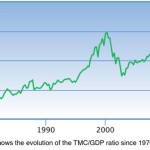
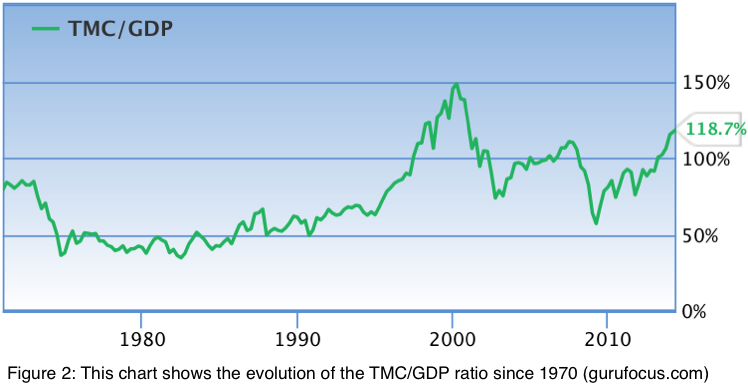
The Total Market Cap to U.S. GNP Ratio (TMC/GNP) is another popular valuation metric that compares the total value of the stock market to the total value of the goods and services produced by U.S. residents. When this ratio rises above 90%, the stock market is considered to be modestly overvalued and when it rises above 115%, the stock market is considered to be significantly overvalued. Figure 2 shows the evolution of the TMC/GNP ratio since 1970. Similar to the P/E ratio, the highest recorded TMC/GNP ratio occurred during the Tech Bubble when it reached approximately 145%; on the eve of the Great Recession the ratio was about 110% and the current ratio is 118.7%. This valuation metric leads to the same conclusion as the P/E ratio – that the market was insanely overvalued during the Tech Bubble and highly overvalued in 2008 and the present day. According to models derived from the TMC/GNP ratio, the stock market is expected to grow at a rate of 1.5% per year for the next eight years.
The P/E and TMC/GNP ratios essentially predict that stock prices should grow over time in proportion to the growth in corporate profits and U.S. economic growth. Since the growth of stock prices outpaced both growth in corporate profits and U.S. GNP, these metrics indicate that the stock market is historically overvalued. Rather than explaining why stocks increase or decrease, these ratios predict which direction the stock market will move from its current levels. Since these trends often take years if not decade to realize, investors shouldn’t use them to time the market, but should rather use them to calculate the downside risks and upward potential of investing in equities.
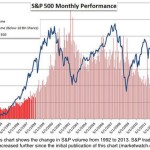
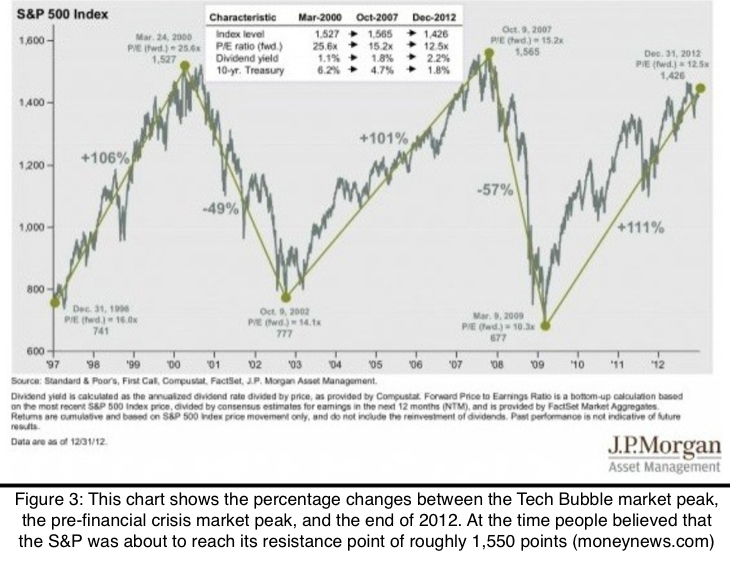
In accordance with these general market valuation heuristics, many financial analysts had proposed a year and a half ago when the S&P was breaking its nominal record peaks, that the stock market would experience a correction similar to that of the bursting of the Tech Bubble and the Credit Crisis. Figure 3 shows a typical illustration of the S&P reaching its resistance point of roughly 1,550 points.
Recent Indicators of an Unhealthy Stock Market
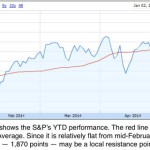
Though this macro resistance point has clearly failed to hold true, as the S&P has already risen above 1,900 points, perhaps the market has reached a different, local resistance point in 2014. Before this past week the S&P had been essentially hovering around 1,870 points since the beginning of the year as shown in Figure 4.
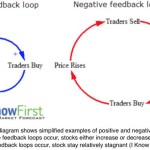
According to his research on the dynamics of the stock market, I Know First’s Dr. Lipa Roitman might consider the S&P index to be in a negative feedback loop where prices stay relatively stagnant despite the hundreds of millions of shares trading daily. The I Know First algorithm predicts that the S&P’s current negative feedback loop will transition into a downward trending positive feedback loop where the price of equities will fall due to some catalyst, which will impel investors to sell their stocks, further driving down the price of equities and feeding the vicious downwards cycle. A simplified example of (click to enlarge)positive and negative feedback loops can be seen in Figure 5.
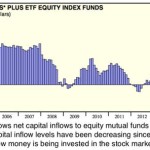
The stock market has been increasing in the past five-years at least in part due to the record level of capital inflow into the equities market as shown in Figure 6.
During the financial crisis, many wary investors removed their money from the stock market, accentuating the decrease in equity values; however, once the market began to recover and provide post gains, investors began to reinvest their savings. This influx of capital inflow into the equity market increased demand for stocks, which therefore pushed up the price of stocks in an upward positive feedback loop. This capital inflow into the equity market had been increasing at a rapid pace throughout the end of 2012 and 2013; however, in the beginning of 2014, this trend seems to have begun to reverse. When there are equal levels of supply and demand for stocks, prices tend to stagnate and when supply begins to outpace demand, equities are at risk of entering a downward positive feedback loop, resulting in decreasing values.
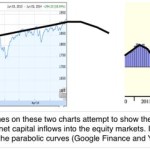
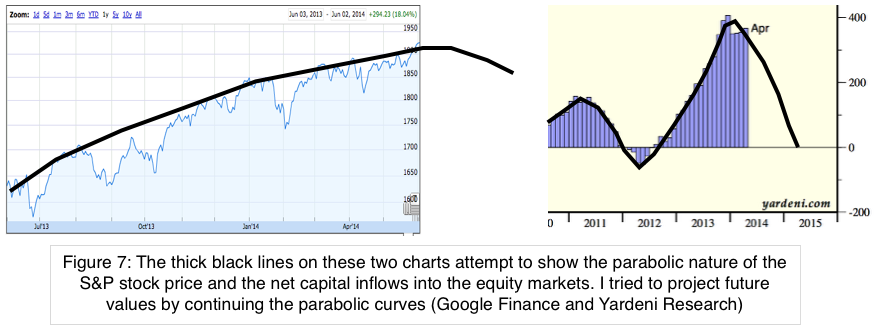
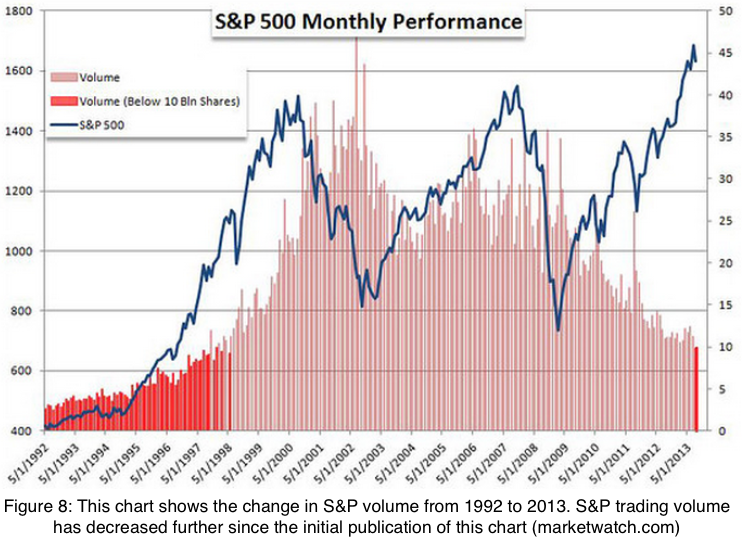
Since the S&P has been growing at a slower rate than in the past few years and since its capital inflows are starting to slow down and even decrease, it appears that the stock market’s momentum has been gradually decreasing in 2014. In mathematical terms: both of their second derivatives are negative, indicating that their first derivatives are gradually decreasing. These trends of decreasing momentum predict that after long periods of decelerating growth, stocks will begin to stagnate and then begin to enter a phase of accelerating contraction. It seems possible that both the S&P price and its capital inflows are both at the top of the parabola, as evidenced by the relatively stagnant levels of growth. Figure 7 attempts to show these parabolic trends. It’s also important to note that trading volume has also been on a steady downward trend during the same time period, as shown in Figure 8, which leaves the S&P much more vulnerable to small (click to enlarge)moves in the market. This is particularly troubling because decreasing the capital inflow levels even slightly can have an oversized effect on the stock market’s momentum.
The stock market often stagnates after long periods of growth when “smart money” investors begin to reduce their exposure to the equity market by taking profits on their investments. This capital outflow is countered by the capital inflow from latecomer investors trying to profit finally from the seemingly endless rally. It seems that such capital flow dynamics are currently occurring. Warren Buffet who had been heavily promoting equities for the past five years has begun to reduce his exposure to American “consumer product stocks” by 21% and has expressed his general disappointment in American equities. Hedge fund manager, John Paulson has been unloading his positions in U.S. banks and retailers. George Soros, the billionaire investor who made more than a billion dollars shorting the British pound, has been gradually buying puts on the S&P, increasing his hedge to 11.13% of his portfolio. These selloffs may be just part of larger trading strategies, but they do seem to demonstrate a growing uncertainty about American consumer spending and a sustained S&P rally.
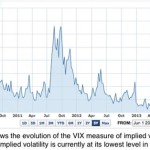
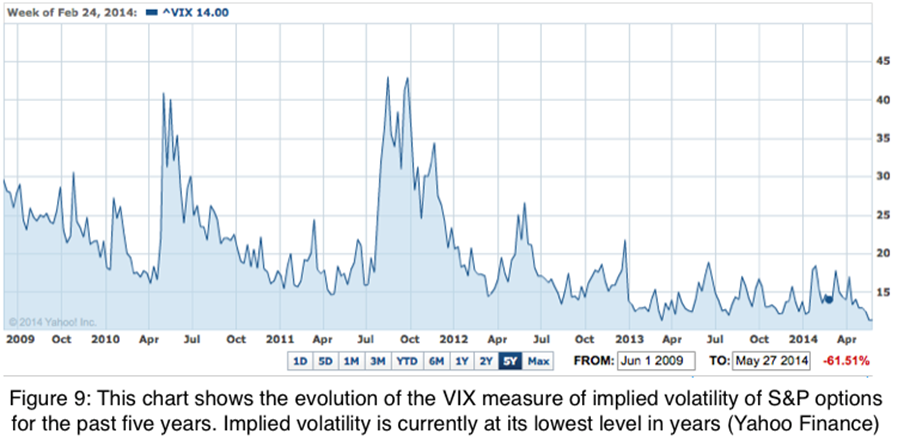
Perhaps more apparently, Wall Street firms seem to have driven the tech and biotech selloff in April by divesting from their riskiest assets to protect themselves from anticipated increased volatility. Deutsche Bank strategist, Keith Parker asserted that “performance over the last month across stocks and sectors has been driven by position covering” of large Wall Street banks and hedge funds. Henry Herrmann, the CEO of Waddell & Reed Financial said, “the market has had a hell of a run and to see people taking money off the table is not that surprising.” We have already seen the effect hedge funds can have on the stock market when they took profits in January and it’s scary to think that a slight increase in implied volatility, as occurred in April, could cause a widespread selloff. Market volatility has been decreasing relatively steadily for the past five years and is currently at its lowest point in years, as is shown in Figure 9. Wall Street’s selloff of the most volatile stocks likely indicates that many firms are anticipating higher volatility in the near future, which is very likely considering that there is very little risk priced into the market. Goldman Sach’s David Kostin explained that “the S&P has risen on average by 5% following momentum sell-offs like this, led by value stocks that underperformed as growth stocks were going up.” However, if investors again fear that volatility will rise, value stocks may be sold off as well. (click to enlarge)
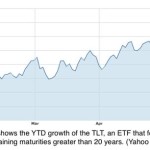
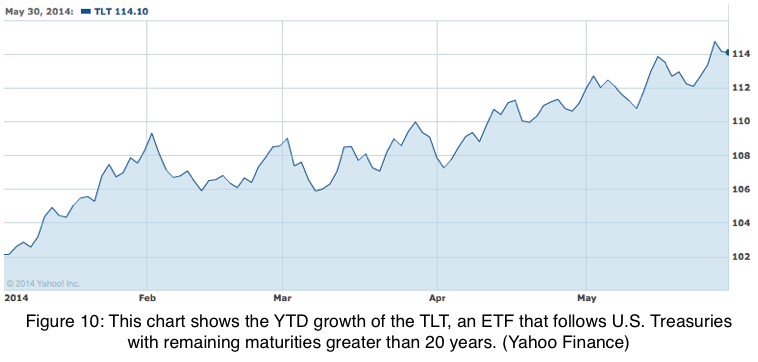
Perhaps Wall Street’s fear of a collapse has led to the irregular current situation where both stocks and bonds have been increasing in value. The iShares Barclays 20+ Yr Treas. Bond ETF, an ETF that follows treasuries with remaining maturities greater than 20 years, has a beta of -0.64, indicating a general inverse relationship with the S&P. Bonds have risen more than 12% in 2014 (Figure 10) despite the Federal Reserve’s promises to taper quantitative easing and eventually raise interest rates.
Stifel Nicolaus’ Dave Lutz claimed that demand for treasuries has been drastically increasing from hedge funds, banks, pension funds, banks, and Asian governments. Lutz attributes the rise in bond demand and prices to low liquidity in the bond market, low inflation, and as a hedge against the recent lackluster economic news. DoubleLine Capital’s CEO, Jeffrey Gundlach believes that bond prices have been increasing due to a short squeeze in the market. Gundlach argues that bond prices will continue to increase as the plethora of investors who have been shorting bonds in anticipation of rising interest rates are forced to cover their positions.
It seems bond prices are increasing as investors seek hedging opportunities against a more volatile market and as short sellers cover their positions. Pension funds in particular have been driving demand for U.S. Treasuries as they try to reduce their portfolios’ volatilities; and bond prices can be expected to increase further as more large investors seek safer assets. Perhaps the stock market has been relatively stagnant as institutional investors have been shifting their assets into the bond market and retail investors have been continuing to shift their assets into the stock market to catch the end of the current rally. As a result these important capital flow dynamics may appear to be relatively typical. Essentially, we should be wary that stocks and bonds are increasing simultaneously and should consider the possibility that large investors are bracing for a downturn.
Possible Systemic Problems of the American Economy
Perhaps there are some systemic problems with the American economy that pose a risk to sustained stock market growth. The most obvious fear is that the Federal Reserve has infused the economy with too much money, prompting investors to invest this newly created money, which has been leading to overvalued stock prices. Additionally, the low interest rates have essentially forced investors to flee the low-returning bond market and further inflate the stock market. Investors now fear that any drastic change to the Fed’s quantitative easing policies could drive the economy and stock market into downward spiral as investors flee the stock market and rush to repay their debts before interest rates rise.
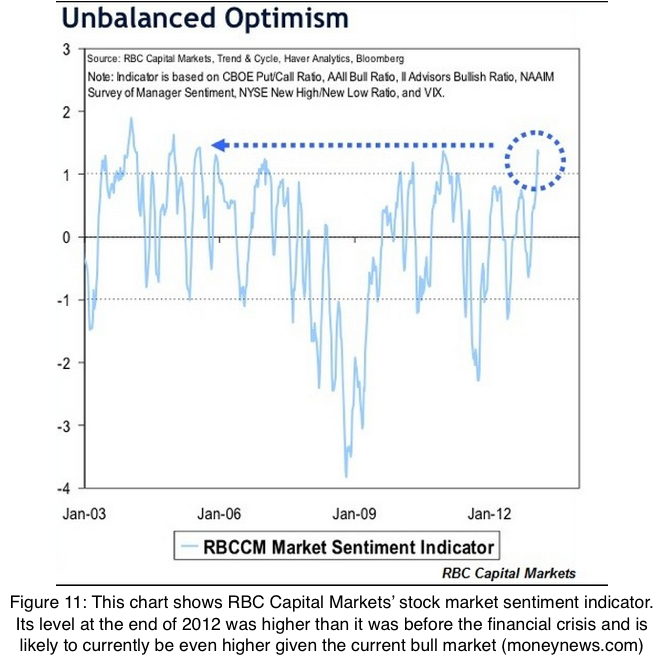
These investors who have been pouring borrowed money into the American equity market are expressing the highest levels of optimism in the stock market since the financial crisis, as shown in Figure 11, and have been artificially increasing demand. When there are such extreme levels of unjustified optimism, many might argue that the stock market is in the final stages of a bubble. (click to enlarge)
There have also been fears that the American economic recovery has not been going as well as initially believed. The U.S. government reported that the American economy contracted by 1% in the first quarter of 2014 and reported that businesses are spending considerably less on inventory, perhaps because they expect consumer spending to decrease in the near future. And of course there are still fears that America’s debt is too massive to service and will erode the value of the dollar and all dollar denominated assets.
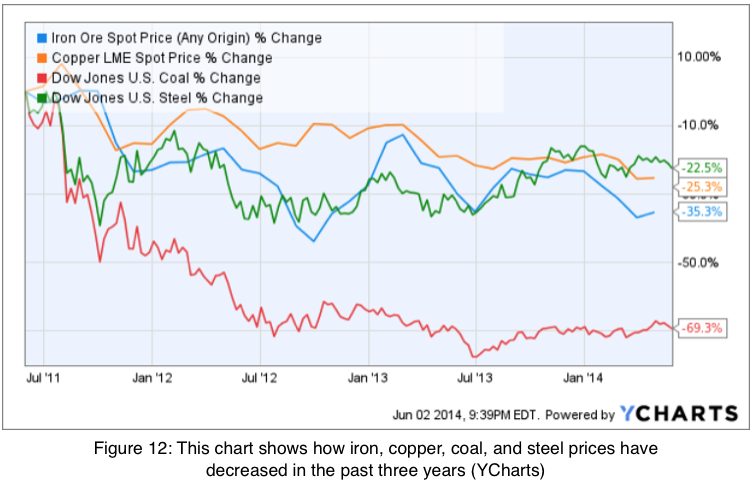
Generally, when there is an anticipated robust economic recovery, industrial commodity prices should increase in anticipation of economic and infrastructural growth; however, currently industrial commodities are decreasing rapidly. Figure 12 shows how copper, iron, and coal prices have decreased in the past five years. Perhaps these decreased commodity prices can be predominantly attributed to lower Chinese demand, but in our globalized economy negative news in China can easily influence American stock prices.
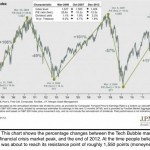
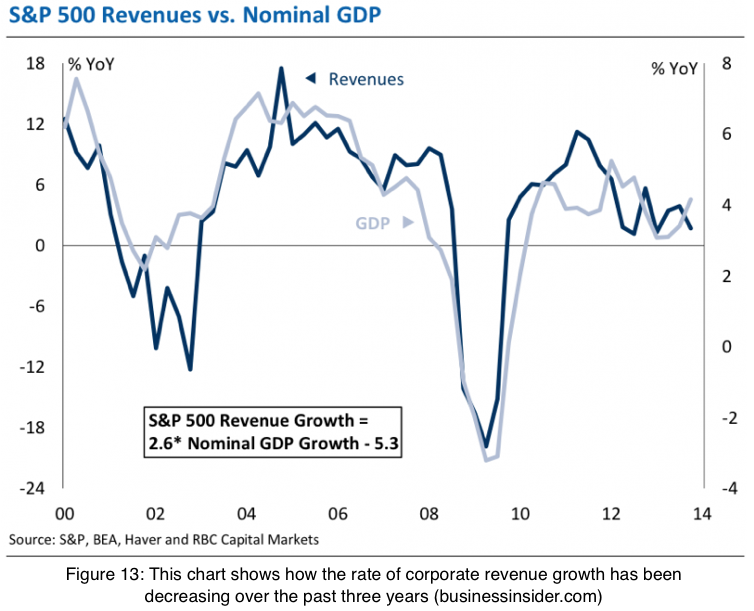
Investors should also be concerned that much of the growth in corporate earnings per share can be attributed to share buyback programs instead of true revenue growth. Many companies that have been taking advantage of the extremely low interests rates to finance these share buyback programs have been reporting increasing profits, even while their revenue growth falls (Figure 13). This is worrying because once interest rates rise, the stagnation in revenue growth will be much more accentuated. Miller Tabak’s chief economic strategist, Andrew Wilkinson said that companies that have been aggressively buying back their stocks have been outperforming the S&P by approximately 20% illustrating that many of the recent increases in stock prices are artificial.
Ultimately, the stock market should either stagnate or decrease regardless of whether the American economy improves or not – if the economy doesn’t recover the market should reflect such realities and if the economy shows robust signs of improvement, the Fed will proceed with its QE tapering, thus pushing down the market. This Catch-22 reflects the reality that the stock market has little more upside to eke out. Ironically, the stock market has the best chance of increasing if the economic indicators continue to be ambiguous and lackluster; however, sooner or later the Fed will need to raise interest rates, putting a damper on the stock market rally.
Reasons to Believe that the Upcoming Correction Won’t Be Catastrophic
In retrospect, it is generally accepted that there was a global real estate bubble that began to burst in 2007, but most economists don’t go so far as to claim that there was also a simultaneous equity bubble. Stocks may have been historically overvalued according various metrics like the Shiller P/E ratio and the TMC/GNP ratio, but they were not necessarily irrationally overpriced as they were during the Tech Bubble of the late 90’s. Instead many economists attribute the decrease in equity prices to genuine fears about the failures of America’s financial institutions, a subsequent credit crisis, and general economic concerns.
If the correction in 2008-09 wasn’t the bursting of an equity bubble, but rather a setback due to economic uncertainty, then perhaps the current stock valuations are still fairly valued. Perhaps now that investors realize the long-term benefits of investing in stocks, the overall mean demand of equities will increase and thereby establish a higher long-term mean value for stock prices relative to their earnings. Although there may not be any systemic problems with the U.S. economy and stocks may not actually be inherently overvalued, there is still a relatively large likelihood that the stock market could face a large correction in response to a series of unfavorable catalysts. At the current frothy equity valuations, it would be prudent to diversify into assets that are less correlated with the S&P.
I Know First’s Current S&P Forecast
I Know First is a financial startup that provides daily investment foresight based on an advanced self-learning algorithm. The algorithm is based on artificial intelligence and machine learning and also incorporates elements of artificial neural networks and genetic algorithms. This unique financial market-forecasting algorithm analyzes, models, and predicts over 1,400 markets in the short, medium, and long-term time horizons. I Know First’s forecasts cover stocks, ETFs, world indices, commodities, currencies, and interest rates.
I Know First specializes in longer-term algotrading, a market neutral strategy that is suitable for most investors. Its algorithm analyzes the structure and trends of the market, finds predicable patterns, and recommends trades based upon its machine-derived forecasts. Algorithms objectively value stocks and protect investors against irrational psychological pressures, volatility, risks, and high transaction costs.
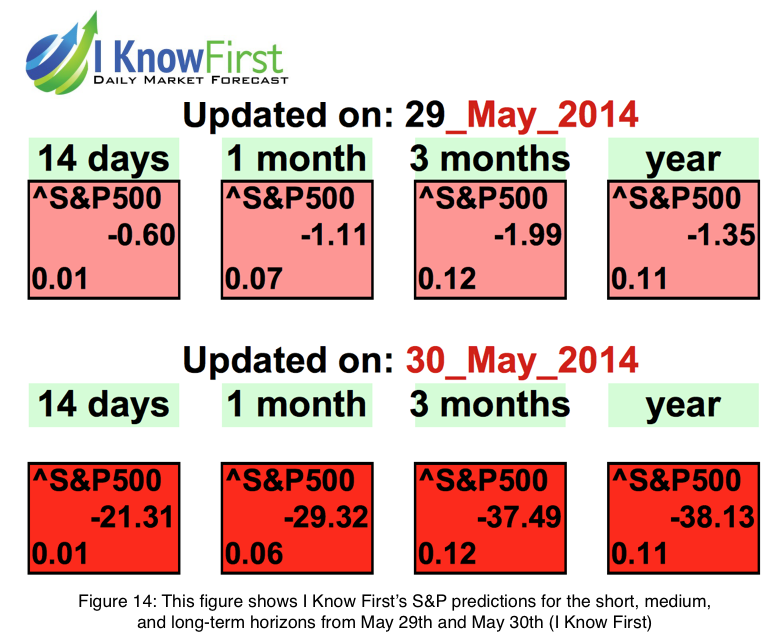
Throughout the past few years, I Know First has consistently maintained a bullish outlook for the major U.S. indices, except for brief periods as in late November when the algorithm predicted slight decreases in the 1-month and 3-month time horizons. This past week in the wake of record S&P gains, the algorithm became strongly bearish for the first time in years, as is shown in Figure 14.
The dark red hues indicate “strongly bearish” sentiments and the light orange hues indicate “moderately bearish” sentiments. The negative number in the box labeled ^S&P500 is the stock’s signal that represents the direction and magnitude the algorithm believes the stock will move. When analyzing a stock’s signal it is important to compare its present signal to its own historical signals and to thereby track its daily changes. If we compare Thursday’s 1-month S&P signal of
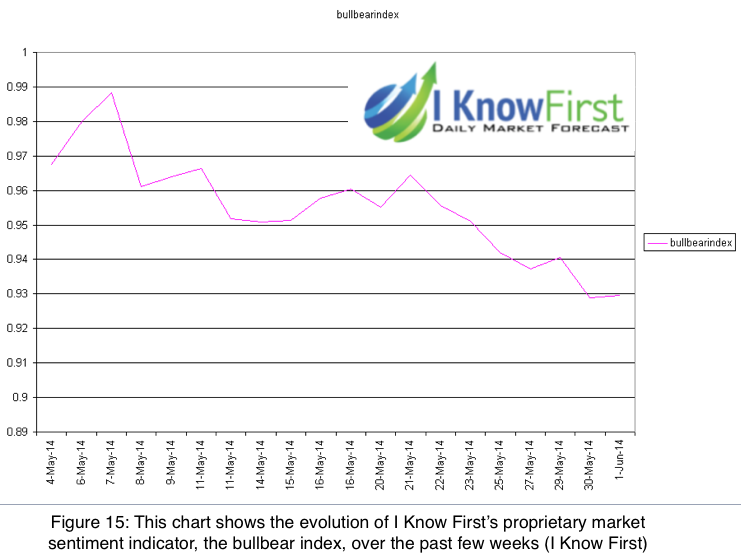
-1.11 to Friday’s 1-month S&P signal of -29.32, we can clearly see that I Know First’s S&P forecasts are becoming more negative. Additionally I Know First’s proprietary market sentiment indicator, the bullbear index, as shown in Figure 15, shows the algorithm’s decreasing confidence in the stock market during the past few weeks – a y-value below 1.00 indicates bearish sentiment.(click to enlarge)
Some Diversification Techniques
Although some major financial advisors such as Blackrock’s CEO, Laurence Fink’s encourage investors to put 100% of their assets into equities because stocks have historically been the best performing asset class, I believe this advice is unwise, especially when equities are as historically overpriced as they are now. Equities are some of the most volatile assets, and those who time the stock market poorly can suffer devastating losses. When the downside risks far outweigh the upward potential, as I believe they do now, I would advise investors to take precautions to protect their savings by hedging their portfolios.
Shorting the Stock Market
Since the stock market’s generally trajectory is strongly upward, it is rarely a good idea to short the market for sustained periods of time; however, in highly uncertain stock market conditions, shorting the market is a useful method to hedge one’s portfolio.
Simply buying an inverse S&P ETF is a relatively silly short because that essentially negates whatever S&P holdings you might be holding – a better option may be to buy S&P puts, as George Soros has done, to limit downside risk. Alternatively, investors should look to short laggard stocks and industries that seem positioned to underperform the S&P index. Every day, I Know First identifies 10 stocks that it believes are the most likely to decrease by the greatest magnitudes. Despite its positive S&P predictions at the time, I Know First correctly identified U.S. Steel’s, ArcelorMittal’s (MT), and gold’s 2014 declines. If the market decreases in the near future as I Know First is forecasting, the algorithm’s short opportunities should be all the more profitable.
I don’t claim to know the ideal percentage of your portfolio to devote to short selling, but it should reflect the amount of contrarian risk you’re willing to assume. If you want to take large short positions in the market, it may be a good idea to gradually increase your positions rather than to simply invest it at once. On average, short positions lose money over time, so it is important to be prudent and attentive to these investments.
Reducing Risk through Conservative, High-Dividend, and S&P Uncorrelated Equities
One strategy to mitigate downside risk while still staying mainly invested in equities is to divest from volatile growth stocks and reinvest that money in conservative, high-dividend, and market-uncorrelated equities. If there were to be a market correction, established blue chip companies with relatively low betas would likely fall less than the S&P index and far less than technology and retail stocks. Such industries include non-cyclical consumer goods and services, tobacco, fast food, and telecommunications. Many of these established companies also dole out relatively high dividends as they have extra profits to spare and don’t need to invest too much in R&D and expansion. These dividends can provide an extra cushion if there were to be an equity downturn. Lastly, investing in industries that are relatively uncorrelated with the S&P index such as utility companies and real estate investment trusts can reduce one’s exposure to the stock market. Every day, I Know First releases a list of 10 conservative stocks and 10 high dividend stocks, which have lower downside risk, that it believes have the greatest potential to increase. In sum, redistributing assets away from volatile stocks and toward more conservative stocks is a good way to limit downside risk.
Traditional Hedging Assets
Bonds are the most traditional hedges against decreasing equity prices. U.S. Treasuries, one of the most conservative classes of bonds, have been performing spectacularly this year and seem positioned to increase in value further if demand continues to increase. Bonds are currently heavily shorted since interest rates are at near bottom levels and are inevitably going to rise as the Fed proceeds with QE tapering; therefore, bonds are currently relatively risky investments as well.
Gold and other precious metals are the other popular hedging asset class. In my June 2013 Seeking Alpha article, I expressed my belief that gold was tremendously overvalued and even though gold has fallen nearly 10% since then, I still feel the same way. However, despite my long-term bearish sentiment toward gold, precious metals can definitely be good short-term hedges.
Of course investors can minimize risk by keeping their savings in cash and cash equivalents such as money market funds, but by doing so they forfeit their ability to earn any significant financial gains and actually lose value at the hands of inflation. Though there may be many better investments available, cash holdings have little downside risk and can be efficient hedges for portfolios.
Conclusion
The stock market is currently in a precarious situation because much of its growth over the past few years has been inorganic. The Fed’s quantitative easing policies gave companies and investors access to inexpensive capital, which they then used to increase equity demand and drive up prices. Consequently, stock prices have been increasing despite a sluggish American economic recovery and decelerating growth in corporate profits. There are many market indicators that suggest that the market may be nearing its peak including decelerating S&P growth, decreasing rates of capital inflow into the market, and a recent correction in the most volatile industries.
The stock market is also exceedingly vulnerable due to the historically low trading volume and market volatility as well as the Fed’s QE tapering strategy. Therefore, negative catalysts, such as an increase in implied volatility, can have outsized effects on the market. The technology and biotechnology sectors were hit strongly when Wall Street had only slight doubts about their future prospects. Although conservative value stocks may now be growing as former tech money flows into them, similar catalysts can have significant effects on value stocks as well.
Again, though I don’t necessarily believe there will soon be a major correction, I do believe that the downside risks of remaining heavily invested in the equity market far outweigh the potential upside. If there were a 60% chance that the stock market will increase by another 5% this year, a 30% chance the market will decrease by 10% this year, and a 10% chance the market will decrease by 30%, the expected value of one’s investments would be -3%. This simple model demonstrates the influence that downside risk can have on a portfolio, even if one were to attribute a greater than 50% likelihood to Wall Street analysts’ high-end forecasts.
In times when the risks of investing in stocks outweigh the potential rewards, I believe that it is prudent for investors to take additional precautions to protect their savings by hedging their portfolios. I suggested various ways to do so including shifting investments from riskier equities to more conservative ones that are less volatile and pay higher dividends, investing in hedging assets such as bonds and precious metals, and taking some well-researched short positions. Of course it would be nice if equities would continue to rise at their current pace indefinitely, but we have to be realistic and can’t ignore the cyclical nature of the stock market. Whenever any asset surpasses its peak, it is important to reevaluate its fundamental value, to recalculate the costs and benefits of maintaining the investment, and to consider whether you’d still opt to reinvest in it if your investment were to be “accidentally” liquidated.
Business relationship disclosure: I Know First Research is the analytic branch of I Know First, a financial startup company that specializes in quantitatively predicting the stock market. This article was written by Ethan Fried (Harvard College ’16) one of our analysts. We did not receive compensation for this article (other than from Seeking Alpha), and we have no business relationship with any company whose stock is mentioned in this article.
Source:
Why The Downside Risks Of The Stock Market Currently Outweigh Its Potential Benefits
Disclosure: I have no positions in any stocks mentioned, and no plans to initiate any positions within the next 72 hours. I wrote this article myself, and it expresses my own opinions. I am not receiving compensation for it (other than from Seeking Alpha). I have no business relationship with any company whose stock is mentioned in this article. (More…)
Original article:
Why The Downside Risks Of The Stock Market Currently Outweigh …
See which stocks are being affected by Social Media

