
Bullish Bond Patterns Could Foreshadow Stock Market Correction
April 05, 2014 at 10:04 AM | written by Arthur Hill
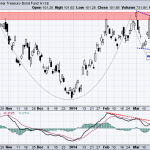
The 7-10 YR T-Bond ETF (IEF) is tracing out two potentially bullish patterns and chartists should watch these patterns for clues on the stock market. The chart below shows IEF hitting resistance in the 102.25-102.5 area and then correcting with a falling wedge. With Friday’s big surge, “correcting” could be the key word here because a breakout would signal a continuation of the January advance. Note that stocks were weak when Treasuries advanced in January. Taking a step back, notice that the ETF is also forming a big cup-with-handle, which is a bullish continuation pattern. A break above rim resistance would also be bullish and argue for a move to the 105 area. The height of the cup is added to the breakout zone for a target. The indicator window shows MACD falling just below zero the last few weeks. A break above the red trend line would reverse the downswing in MACD and turn momentum bullish.
Click this image for a live chart
Even though we have yet to see a breakout, note that strength in Treasuries could be negative for stocks for several reasons. First, stocks and Treasuries have been negatively correlated for most of the last five years. Second, money flowing into Treasuries is money that is not available for stocks. Third, Treasuries rise as the outlook for the economy falls. Fourth, strength in Treasuries reflects a certain risk aversion in the market. This risk aversion was reflected in the stock market because small-caps and techs are bearing the brunt of selling pressure on Friday.
Good weekend and good trading!
Arthur Hill CMT
Follow this link:
Bullish Bond Patterns Could Foreshadow Stock Market Correction
See which stocks are being affected by Social Media

