


Daily Technical Analysis – 25 November 2013 | Alpari Newsroom …

Daily Technical Analysis – 25 November 2013
November 25, 2013
by
in
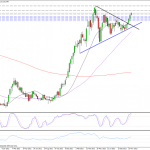
EURUSD
The euro is looking bearish again this week, having failed to break back above the ascending wedge. Even the weekly chart is looking a little bearish, with last week’s candle being a hanging man, signalling a trend reversal. It is worth noting that this is not a perfect hanging man. The body is a little big, the lower wick could be a little longer and the body is green, but it is still valid, just about. As it’s not perfect, I wouldn’t base too much on it though, I would just use it as more of an indication of future price action. The daily and 4-hour charts look a lot more bearish. Following the break below the ascending wedge, we did see a rally in the pair, however the inability to break back above the wedge is very bearish, as is the response since. The failure to break back above acts as confirmation of the break, which should now prompt a move towards last week’s lows, around 1.34, followed by the November lows, around 1.33. Further support could be found along the way around 1.3358 and 1.3317, both of which are previous levels of support. If we see the pair turn higher, resistance should be found around 1.3560, today’s high, which coincides with the 200-period SMA on the 4-hour chart.
GBPUSD
There’s a lot of indecision in this pair at the moment, as seen on the weekly chart below with a lot of choppy trading between the 1.59 support and the descending trend line, which dates back to April 2011. The failure again last week and this morning to break above the trend line suggests this is going to continue for now. The daily chart also confirms this indecision, although it better highlights the slight bullish bias. As you can see below, we had the strong uptrend in the pair, starting in July, followed by what looks like a flag formation. This is typically a bullish continuation pattern, hence the bullish bias. However, the break of the ascending trend line, for me, has slightly increased the odds for a break below the flag, as it suggests the market is much less bullish than it has been over the last five months or so. The 4-hour chart also supports the continuation of this sideways trading. Earlier on this morning, we had a clear bearish signal around the descending trend line, with the price action recording higher highs, while the stochastic recorded a lower high. This is a negative divergence and is very bearish, especially when combined with a resistance level. In terms of possible support levels now, we have 1.6175 and 1.6150, previous resistance, with the former also being the 38.2% retracement of the move from 21 November lows to 25 November highs, and the latter almost coinciding with the 50% retracement of the same move.
USDJPY
The dollar is continuing to rally against the yen this morning, having broken through a number of key resistance levels over the last few weeks. The pair has broken above 101.50 this morning, a previous level of resistance, which, if we see a daily close above here, should prompt a move towards 102.50. This has been a very aggressive move higher so far, without any significant retracements along the way. On a couple of occasions we’ve see a pause in the rally, as shown by the flag and pennant formations on the 4-hour chart, but no real correction. I therefore think a correction is on the cards very soon, making the next two resistance levels, 102.50 and 103.72, very important. If we do, the previous resistance levels, highlighted below, along with the key fib levels, will become key levels of support for the pair. For now though, it is continuing to move higher and unless we see a break above the next continuation pattern, be it a pennant, flag or anything else, I expect it to continue.
Author: Craig Erlam
Tagged EUR/USD, foreign exchange trading, forex, forex uk, FX, GBP/USD, Metatrader 4, MT4, MT5, Technical analysis, USD/JPY
View original article:
Daily Technical Analysis – 25 November 2013 | Alpari Newsroom …
See which stocks are being affected by Social Media

