
Daily technical analysis – 28 April 2014 | Alpari Newsroom | Live …
Daily technical analysis – 28 April 2014
April 28, 2014
by
in
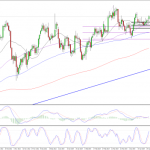
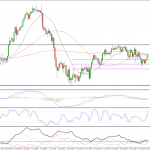
EURUSD
Following two weeks of sideways trading in this pair, the euro has finally broken higher against the dollar and closed above the 1.3850 resistance on the 4-hour chart. This could now prompt the next bullish move in the pair, although in the short term, we could see a retest of that 1.3850 resistance which should now provide support. Should we see this, it would act as confirmation of the initial break and therefore be a very bullish signal. The next target for the pair should now be the 11 April high of 1.3905. This roughly coincides with the target following the breakout of the triple bottom, which based on the size of the formation suggests we should see a move towards 1.3915. While I do think this will materialise, we may have to wait a little longer with the pair likely to find strong support around 1.39, round number and pretty much in line with that previous resistance.
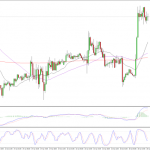
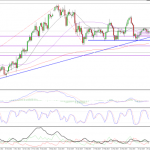
GBPUSD
This pair has also finally broken out of its trading range this morning, having traded in a 70 pip range for almost two weeks. The break hasn’t been as strong as I would like, having only broken the resistance by 13 pips, but the rally that led to the break was very strong which gives me a little more confidence. As long as we don’t see a close back inside the range now, I would expect to see a continuation of the rally over the course of this week. On the 4-hour chart, the latest candle looks like a doji, which can be seen as a reversal pattern. But don’t be fooled, firstly the candle hasn’t been completed yet. Secondly, on a lower time frame, say 30-minute this looks like a consolidation following a strong rally, which is a bullish continuation pattern. Assuming we don’t see a move back inside the previous trading range, the next target should be 1.6902, 161.8% fib expansion level. The pair should then run into resistance around 1.70. This is a big psychological level and shouldn’t be overlooked. Above here is 1.7042 which is the high from 2 August 2009.
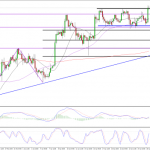
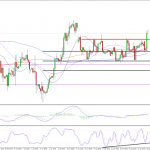
USDJPY
The dollar is trading higher against the yen today, having found support from the 50 fib level – 11 April lows to 22 April highs. The 50 and 200-preiod SMAs on the 4-hour chart and the 50-day SMA are currently providing strong resistance for the pair but I expect this to be temporary. In period of sideways trading, like we’re seeing at the moment in this pair, the moving averages are less useful as support and resistance. For now, they are both holding but I don’t expect it to last. Having bounced nicely off the 50-fib level, we could now see another attempt to break above the trading range. Given that we’ve already seen a break out of their trading ranges in EURUSD and GBPUSD, it wouldn’t be a surprise if this followed, and a break to the upside still looks much more likely. Any move to the downside is being made with less and less momentum which suggests the bears are losing this one. Of course, a close above 102.70 is needed to confirm this, potentially then opening up a move to 103.75 and 104.12, the highs from the last two rallies.
Author: Craig Erlam
Tagged EUR/USD, Fibonacci, Fibonacci Expansion, Fibonacci Retracement, foreign exchange trading, forex, forex uk, FX, GBP/USD, Metatrader 4, Moving Averages, MT4, MT5, Resistance, Support, Trend line, USD/JPY
View article:
Daily technical analysis – 28 April 2014 | Alpari Newsroom | Live …
See which stocks are being affected by Social Media

