
Daily technical analysis – 6 January 2014 | Alpari Newsroom | Live …
Daily technical analysis – 6 January 2014
January 6, 2014
by
in
EURUSD
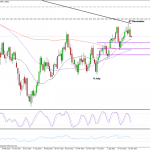
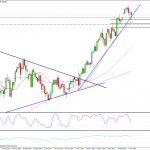
The euro is looking quite bearish against the dollar this week, after last weeks candle closed below the opening level of the week before, resulting in a bearish engulfing pattern on the weekly chart. We’ve actually had a few bearish candles on the weekly chart over the last month or so, all of which have potentially been a warning that a reversal of the uptrend is coming. The daily chart is also looking quite bearish after the pair closed below the neckline of the double top on Friday, following a break of two ascending trend lines over the last few weeks. Based on the size of the double top, this should now prompt a move back towards 1.3450, a previous level of support and resistance, with support being found along the way around 1.3523, a previous level of support and the 61.8% retracement of the move from 7 November lows to 27 December highs. Today the pair is trading slightly higher, but I think this is just a little bit of profit taking following quite an aggressive sell off on Thursday and Friday. The pair should now find strong resistance around 1.3615, the 50-day SMA, and 1.3630, the neckline of the double top.
GBPUSD
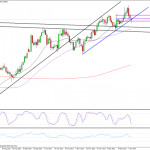
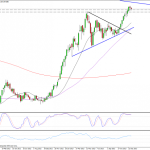
Sterling is still looking bullish against the dollar in the longer term, despite recording it’s first losing week in three, last week. Last weeks candle almost looks like a shooting star, but in my opinion, the body is too big. The upper shadow is exactly twice the size of the body, so technically it would pass as a shooting star. However, I still see this as a weaker bearish indicator than I would if the body was smaller, or the upper shadow was longer. That said, as with other candlesticks formations, like the hanging man, it should still act as a warning that the market is not as bullish as it has previously been and could turn more bearish in the coming weeks. I think today’s candle could provide key clues about the future direction of the pair. If we see a close above the blue ascending trend line and 20-day SMA, this would be very bullish as it would show that the market is still buying at these key support levels. It would also result in a nice hammer candlestick, which is very bullish, especially near such a key level of support. If however we see a close below this level, it would suggest that the pair has in fact turned more bearish, with the next big level of support coming around 1.6270, the ascending trend line which dates back to 5 August 2009. The key level for me though would be the trend line below this, around 1.62, which has previously acted as support and resistance for the pair. A break below here would confirm that the trend has reversed and the pound is looking much more bearish going forward.
USDJPY
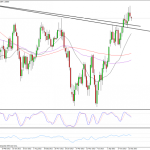
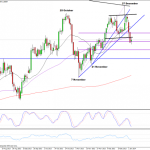
The dollar is continuing to look bullish against the yen despite the surprisingly poor start to the week. Last weeks hanging man candle could be an early indication of selling in the coming weeks, but I’m not convinced. Like the inverse hammer, I think this should be taken with a pinch of salt, and seen more as a potential reversal warning than an actual reversal indicator. The daily chart certainly doesn’t suggest we’re going to see a reversal at this stage. In fact, Friday’s candle is a very bullish hammer, especially as it coincides with a few big support levels, the 38.2 fib level, ascending trend line which dates back to 7 November and a previous resistance level. If we see a close below here on the daily, I will take the hanging man candle on the weekly more seriously, but until then I remain bullish, with the next target being last week’s highs of 105.43. It looks as though we’re seeing a double bottom form on the 4-hour chart, which should prompt a move beyond last week’s highs if the neckline is broke. This neckline is also the neckline of the previous double top, so a break above would be even more bullish, while a failure to break could be viewed as very bearish.
Author: Craig Erlam
Tagged EUR/USD, foreign exchange trading, forex, forex uk, FX, GBP/USD, Metatrader 4, MT4, MT5, Technical analysis, USD/JPY
Continue reading:
Daily technical analysis – 6 January 2014 | Alpari Newsroom | Live …
See which stocks are being affected by Social Media

