
Gold (XAU/USD) – Comparing the Reward to Risk Profile of 2 Trade …
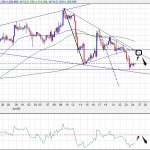
Gold fell to a new low on the month this week, currently around 1288. The 4H chart shows a market that is trading in an ABC pattern. With a C=A projection, the current swing targets the 1270-1275 area.
(click to enlarge)
As we get into the 7/25, Friday session, expect some pullback. Price is trading near a projected support, and the RSI is turning up from oversold levels (below 30).
If we do get a pullback, watch out for resistance around 1305 based on three factors:
1) The 200-period and 50-period SMA.
2) Falling trendline
3) support/resistance pivot
A break above 1310 might look like a bullish breakout and take away the confidence of gold-bears.
Reward to Risk Assessment:
With a bearish target in mind, a pullback anticipated, and a level to put away our bearish outlook, we can assess the reward to risk profile of a fade-the-rally trade idea.
Trade Idea A: Fade the Pullback
Let’s say you confirm resistance around 1305, and enter around 1300. With a stop-loss at 1315, you would risk 15 points. With the target to 1273, you have a reward potential of 27 points. This trade offers a reward to risk ratio just under 2:1. This might not be a very attractive profile, but there is potential downside risk beyond 1270, though we should limit our bearish expectation to 1260. So at best, the reward to risk is still around 2:1.
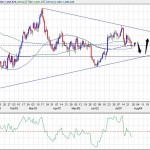
Let’s take a look at a trade from 1260. This idea would be based on respect of the 2014 rising trendline, and the reversion to mean concept: the target is the middle of a price range. Just from eyeing the 2014-price structure, the 1300 handle appears to be the central pivot. You can also think of it as the level that has cut through the most candles. What would be the reward to risk profile of a trade from the triangle support toward the central pivot?
(click to enlarge)
Trade Idea B: Respect Triangle Support; Reversion to the Mean
2) Let’s say you see support above 1260 area, with a possible entry at 1270. The stop-loss should be below the triangle support, perhaps 1255. The target should be the central pivot of 1300. This trade profile offers a reward to risk of 30:15.
This trade offers a a 2:1 ratio, and in that aspect, it is similar to the first trade idea. However, I believe this has more potential reward because if price goes to the triangle resistance, there is room to run at least 15-20 more points. The aggressive target’s reward to risk is therefore to 3:1.
Final Words: If price action remains in the triangle, the reward to risk ration of trades within the triangle will get worse and worse. After the next couple of weeks or month, we will likely have to rely on a breakout for trading ideas.
To contact the reporter of this story, email Fan Yang at [email protected]
Previous Post: NZD/JPY Breaks a Key Rising Trendline in a Double Top Attempt (7/25)
Related Articles
GBP/USD Breaks Trendline Support; Look for Sellers on a Pullback Jul 25, 2014
NZD/JPY Breaks a Key Rising Trendline in a Double Top Attempt Jul 24, 2014
UK and US Data Drive GBP/USD Below 1.70 Jul 24, 2014
EUR/USD Trying to Make a Stand after Stronger PMIs Jul 24, 2014
Trade GBP on Rising Channel Bounce — July 24, 2014 Jul 24, 2014
Sponsored investing with Binary Options
About: Forexminute – Fan Yang
Fan Yang has been a professional forex trader and analyst since 2007. He specializes in technical analysis and has a Chartered Market Technician designation since 2011. He was the chief technical …
View all of Fan Yang’s Articles »
More here:
Gold (XAU/USD) – Comparing the Reward to Risk Profile of 2 Trade …
See which stocks are being affected by Social Media

