
How To Trade Earnings Season – June Review | Seeking Alpha
Summary
Stocks that had big-volume breakouts off earnings beats fared moderately well in June, averaging 4% on a 10-day holding period.
This breakout strategy is a “home-run” type, in that it produces a few big winners and lots of small losses and flat trades.
Google looks like a very promising candidate for the strategy and it releases earnings on July 17th.
This post will be a follow-on to my previous article How to Trade Earnings Season, which was an extensive back testing (+3000 stocks tested over a 12-year period) of the best ways to trade earnings season. The strategy that yielded the best results consisted of buying stocks that beat earnings estimates and then subsequently had a price breakout on very big volume on the day of release. There were other conclusions as well: stocks that beat earnings estimates after missing the previous quarters tended to significantly outperform in the short term and the magnitude of the EPS surprise was inconsequential in predicting future outperformance.
June Earnings Review
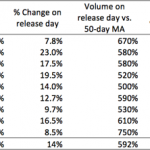
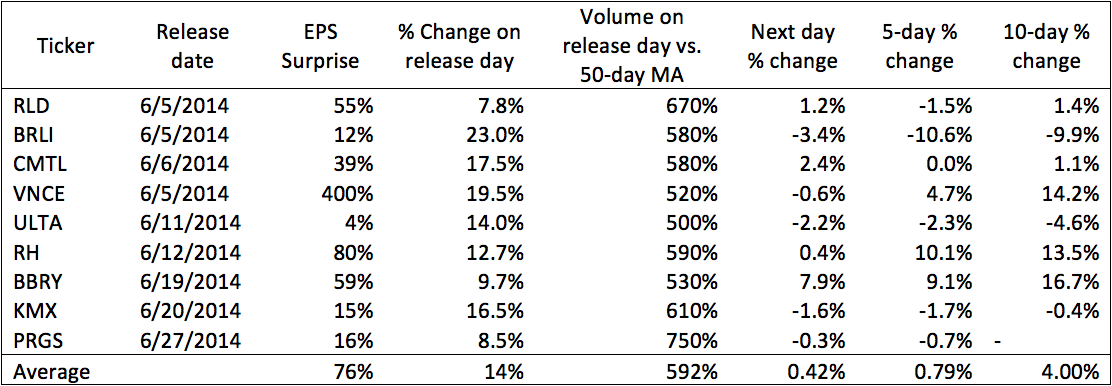
To give readers a better perspective on how to utilize this strategy, I have provided all the stocks that fit this strategy during the month of June. The exact criteria of the strategy was that the stock had to beat consensus EPS estimates, be up more than +5% on release day on volume that was more than 5x the 50-day average. It should be noted that the release date was adjusted for the time of day for when earnings were released, thus if a stock released after-hours on June 1st, then its release date would be recorded as June 2nd as that is the first time the market could react to the news. Returns were calculated on the basis of the closing value of the release date.
Table 1.1 – June breakouts off EPS beats
(click to enlarge)
Source: Author
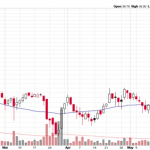
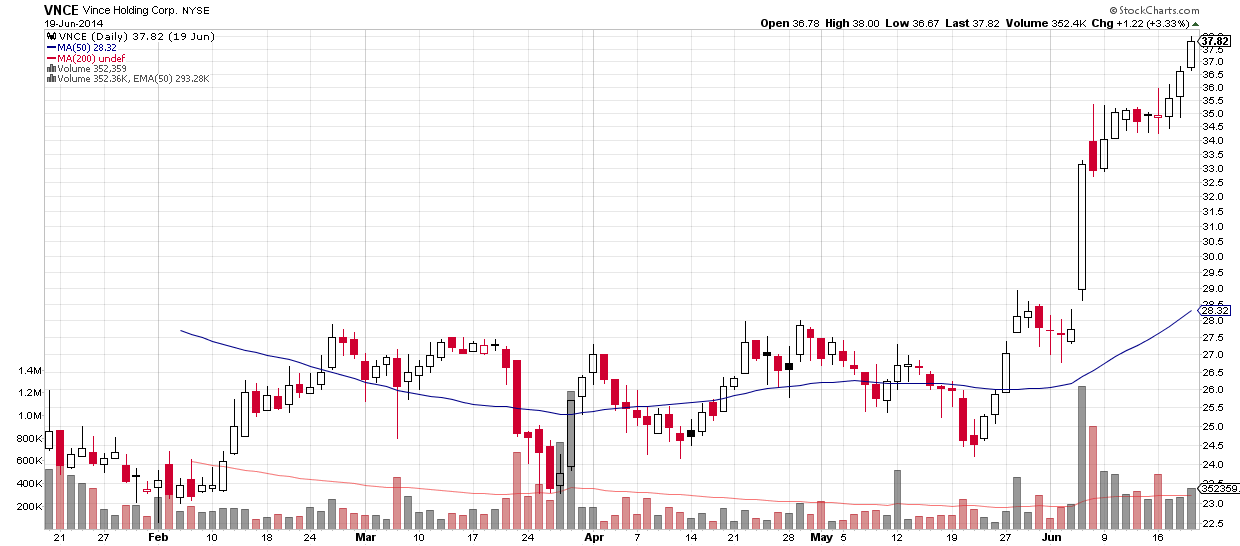
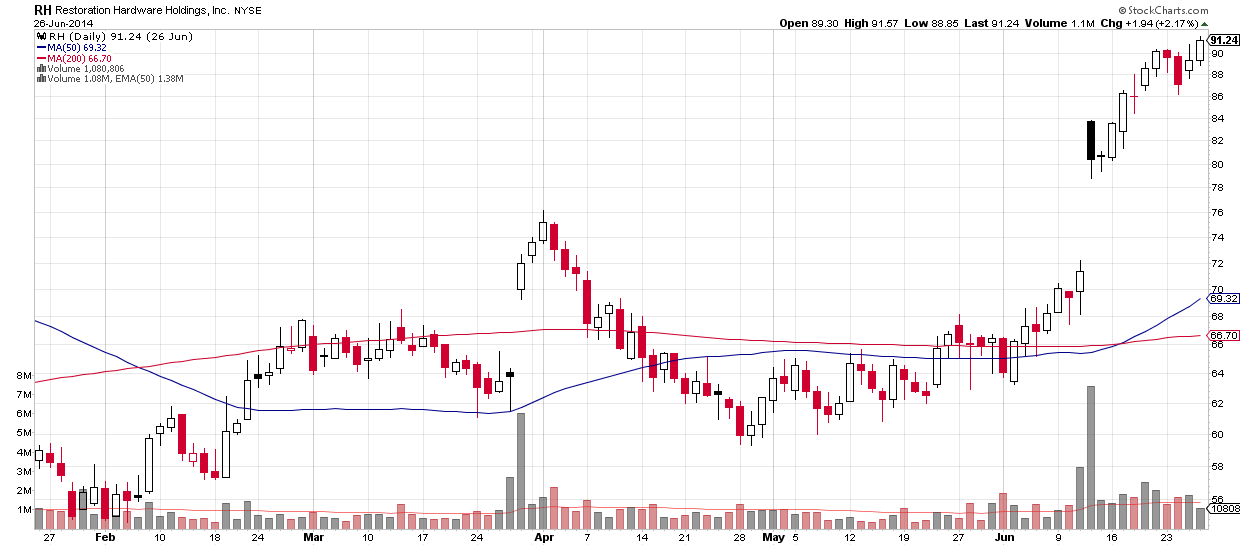
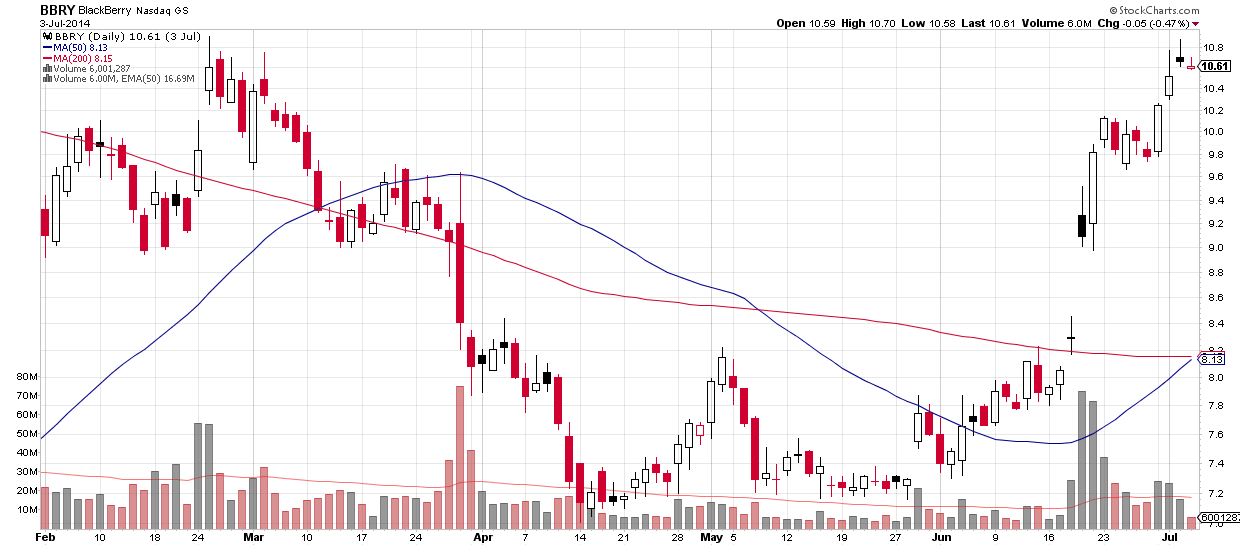
This breakout strategy fared moderately well in June, with investors making an average of 4% per trade by simply buying these breakouts at the close of the release date and holding for 10 days. The strategy is very polarized though, with 3 very big gainers (VNCE, RH, BBRY) and the rest ranging from losses to small gains. These three gainers all were positive almost immediately after releasing as well, which means that investors could benefit from this polarization by setting tight stop losses. That way, investors would be able to take small losses on stocks to protect themselves while not missing out on some of the big gains. The charts of these three gainers are shown below to better illustrate:
Vince Holding Corp.
(click to enlarge)
Chart courtesy of stockcharts.com
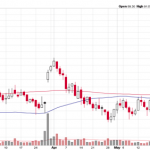
Restoration Hardware, Inc.
(click to enlarge)
Chart courtesy of stockcharts.com
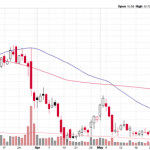
BlackBerry
(click to enlarge)
Chart courtesy of stockcharts.com
Obviously this is merely a sample size of three, but this seems to be a trend in many of the breakouts analyzed in my previous article as many of the big gainers that come from this strategy barely touch negative territory on their way to big price gains. The underlying logic behind this is simple – the big institutions that caused the breakout on big volume on the earnings release day look to continue to add to their positions the following days. Many of these institutions are too big to get their entire fill of the stock on the release day, thus they spread out the purchase over the following days. Additionally, funds love “window dressing” their holdings for prospective investors, so they tend to jump on bandwagons when a stock makes a powerful surge. This supposed “liquidity edge” means that the ex-post alpha generated by this strategy over the last 12 years could signal an underlying ex-ante alpha generation ability that small-time investors could exploit. This edge would most likely be larger in smaller cap stocks, and I will do a more thorough back testing of this edge as I gather more data.
July Earnings Watch
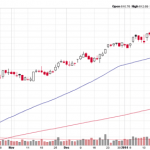
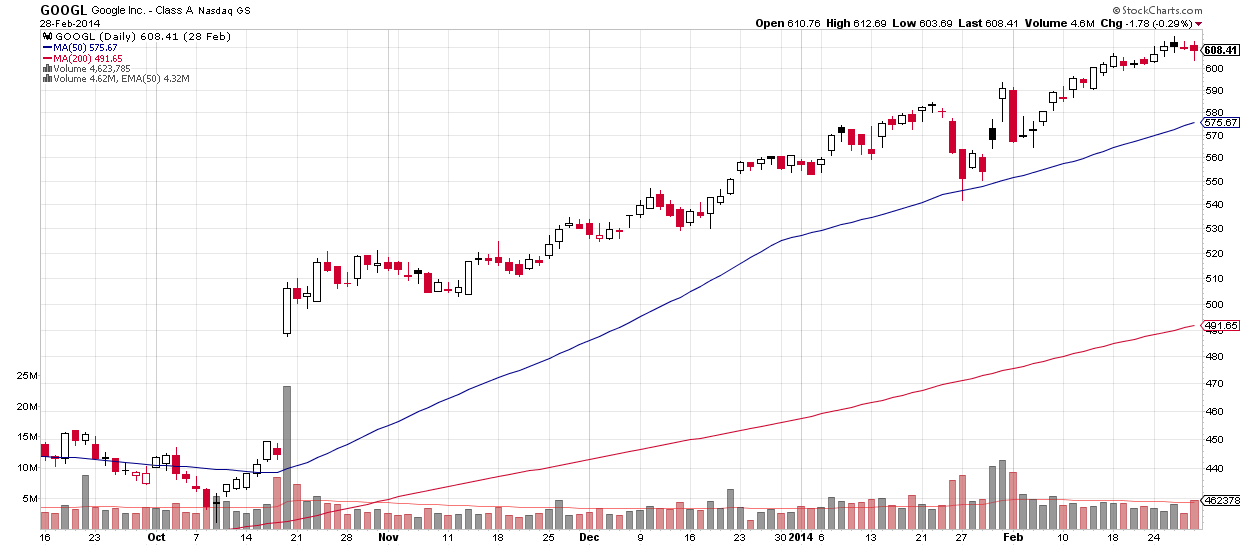
As I mentioned in my previous article, my eye is still firmly trained on Google Inc. (GOOG) (GOOGL) as it has all the pre-earnings release characteristics the strategy looks for. First off, it missed earnings estimates last quarter meaning that if it beats it will have even more momentum than a typical earnings beat. Secondly, it has bottomed out of its 4 month consolidation base but is still more than 7% off its highs, meaning the stock is by no means an overheated stock at the moment. Lastly, the stock has a favorable prior history when it comes to breaking out on big volume off earnings beats, with the chart below showing its Q3 beat back in October.
(click to enlarge)
Chart courtesy of stockcharts.com
Zacks Investment Research has an estimate of $5.16 EPS for the upcoming quarter, and has given it a “Buy” rating. It reports on July 17th.
Source:
How To Trade Earnings Season – June Review
Disclosure: The author is long BBRY. The author wrote this article themselves, and it expresses their own opinions. The author is not receiving compensation for it. The author has no business relationship with any company whose stock is mentioned in this article. (More…)
Originally from:
How To Trade Earnings Season – June Review | Seeking Alpha
See which stocks are being affected by Social Media

