
How To Trade Earnings Season | Seeking Alpha
Summary
Beware of buying stocks based solely on the magnitude of their positive EPS surprise, as it is unlikely to lead to significant outperformance.
Shorting stocks that miss estimates by wide margins (>50%) and covering within a few days is a viable, though not spectacular, strategy.
Buying stocks that beat on earnings after a string of missing estimates is a moderately profitable strategy.
Buying stocks that have price breakouts on very big volume after earnings beats is very profitable, especially if it’s a stock that has had a string of estimate misses.
Introduction
In this article, I will be taking a look into the effectiveness of utilizing earnings surprises as a trade entry. The post-earnings announcement drift (PEAD) phenomenon – in which earnings surprises lead to future abnormal returns in the direction of the surprise – has been well documented academically. Yet there is a surprising lack of research detailing exact trading strategies built around the phenomenon. This article aims to address this discrepancy by analyzing the different ways of utilizing earnings surprises, in an effort to find a strategy best suited for trading earnings season.
To analyze these strategies, I will be looking at historical EPS surprises from 1,598 different stocks spread non-evenly across 4 different industry groups: 456 from the consumer discretionary sector, 158 from the consumer staples sector, 460 from the industrials sector, and 524 from the technology sector. In total, the database consists of 44,982 quarters of EPS surprises starting from 2001 and ending in the most recent earnings season of 2014.
Procedure
For each strategy tested, I will be looking at the average returns that would come from buying the stocks that fit the criteria at their closing value on their first market day after releasing earnings. This would mean buying at the closing value on the day of release for stocks that release in the morning, or buying the next day’s close for stocks that release post-market. The close was chosen as the starting point as the opening price of stocks, especially ones that have just released earnings, is extremely volatile. This closing value is then compared to the close of the following day, week, 2 weeks, and month to get the respective returns for the four hypothetical holding periods.
Each strategy will be analyzed for high relative returns compared to the benchmark return one would earn on average from holding the S&P 500 for the same amount of time. High Sharpe ratios (preferably over 1), across each of the four holding periods. The Sharpe ratios produced in the tables were annualized by multiplying it by the square root of its respective time period for ease of comparison. This calculation implicitly assumes that the returns of each strategy follow a Wiener process, in that volatility scales with the square root of time, which is necessary for simplicity’s sake. Lastly, because my database suffers from survivorship bias (database excludes stocks that aren’t currently listed on the exchange), any stocks that were under $10 at the time were not included in the returns. This is to combat the fact that excluding bankrupt firms inflates returns and to remove the outsized effects microcaps have with their extremely volatile returns.
Buying Stocks Off The Magnitude of Their EPS Surprise
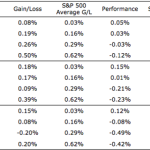
This first round of testing will look at the results of buying stocks based off the percentage that they beat/missed their EPS estimates by. These EPS surprises are classified into seven different categories: mild upside surprises (1-10%), moderate upside surprises (10-50%), large upside surprises (>50%), EPS matches (0% surprise), mild downside surprises (1-10%), moderate downside surprises (10-50%), and large downside surprises (>50%). The results are shown below:
Table 1.1 – Upside EPS surprises
Source: Quantified Alpha Research
Clearly, these results are poor with less than half of the time periods tested even beating the average returns of holding the S&P 500, tells investors to think twice before blindly thinking that their stock will outperform in the short term merely because it beat estimates by a wide margin. I believe this lack of outperformance is due to the fact that the market prices in most of the surprise within the first day of the release. Bigger surprises tended to have bigger average daily moves on the day of release thus nullifying the edge offered by the surprise. Next, we’ll look at the effects of downside EPS surprises:
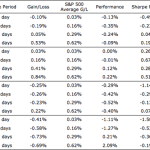
Table 1.2 – Downside EPS surprises
(click to enlarge)Source: Quantified Alpha Research
These results are much less mixed than the previous table, but still offer no truly clear strategies to utilize. The only potential strategy worth using would be to short stocks that miss earnings by a wide margin (>50%), and then covering within the first week or so. Besides that, investors look to avoid stocks that miss by margins of 10% or more as they tend to underperform across all time periods tested, though this is hardly a new revelation. Both the tables above show that basing your buying/selling decisions off solely the magnitude of the EPS surprise offers no significant edges.
Reversal of Earnings Surprises Trend
Because buying stocks off the magnitude of their EPS surprise yielded such mediocre results, we’ll now explore to see if there is any outperformance available from buying stocks that beat earnings after missing estimates the previous quarters.
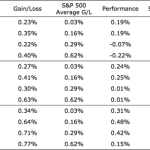
Table 2.1 – Positive EPS surprise after negative surprises
(click to enlarge)Source: Quantified Alpha Research
These results are much stronger than the previous tables, as it is clear that stocks that beat EPS estimates after missing estimates the previous quarters tend to outperform in the week after releasing. The reasoning behind this phenomenon is that because they had missed historically, investors assumed they would miss again. Thus, when they ended up beating estimates, they had much stronger momentum than stocks that had beaten estimates for the third or so quarter in a row. The inverse of this is true as well, as stocks that miss earnings after beating multiple quarters in a row tend to significantly underperform in the short run.
EPS Surprises and Big-Volume Price Breakouts
Lastly, we’ll now explore combining technical analysis with the EPS surprises. The results below show the average returns accrued from buying stocks that beat on earnings and have price breakouts on big volume. I arbitrarily decided that >3% daily change in price was big enough to be considered a breakout, and 5x the 50-day moving average of volume was big enough volume. The results of this strategy are shown below:
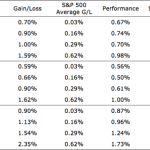
Table 3.1 – Breakouts off EPS beats
(click to enlarge)Source: Quantified Alpha Research
These are very strong returns, and show that EPS beats are much more significant if they have institutional backing, which is signaled by these large price run-ups on heavy volume. Though most of the outperformance comes from the day after earnings release, the 20-day returns are quite strong for each class of breakout as well. I believe that this edge exists in the market because the institutions that are buying up this stock aren’t limited by their immense size, and thus spread out their buying over the course of the next few days after earnings release. Additionally, mutual funds want their fund holdings to have stocks that are doing well in the market, as possible investors look at what these funds hold in determining whether to invest. Thus, when a stock breaks out off great earnings news, funds that don’t already own the stock are anxious to add it to their holdings before it gets even pricier. This institutional backing thesis is validated to a certain extent by the fact that increasing the volume criteria to 10x the 50-day MA led to even better results, thus showing that the more institutional backing, the better. These results are improved even further if combined with the previous strategy, in that the stock has had a string of missed estimates before this quarter.
Q2 Earnings Watch
It will be interesting to see if this historical relationship stands the test of time, as we are 2-3 weeks away from the start of Q2 earnings season. I will be watching the following stocks very closely:
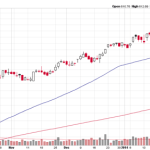
1. Google Inc. (GOOG) – Missed estimates last quarter, making it a prime candidate for the strategy just outlined. Zacks Investment Research has an estimate of $5.15 EPS for the upcoming quarter, and has given it a “Buy” rating. Google also has a history of breaking out on EPS beats on huge volume and continuing to climb higher, with the chart below showing its Q3 beat back in October. It reports on July 17th.
Chart courtesy of stockcharts.com
2. Family Dollar Stores Inc. (FDO) – Has missed estimates the last two quarters, again making it a prime candidate for a strong momentum push the other way should it beat and break out. Plus, you get the benefit of having activist investor Carl Icahn on your side. Zacks has an estimate of $0.90 for the upcoming quarter, and has given it a “Hold” rating. It reports on July 10th.
3. F5 Networks Inc. (FFIV) – Missed estimates last two quarters, making it a prime target for a strong rebound should it beat. Zacks currently has an estimate of $1.05 for the upcoming quarter, and has given it a “Buy” rating. According to Zacks they report July 23rd.
Source:
Disclosure: The author has no positions in any stocks mentioned, and no plans to initiate any positions within the next 72 hours. The author wrote this article themselves, and it expresses their own opinions. The author is not receiving compensation for it. The author has no business relationship with any company whose stock is mentioned in this article. (More…)
Continue reading here:
How To Trade Earnings Season | Seeking Alpha
See which stocks are being affected by Social Media

