
Is Facebook a Healthy Stock for Your Portfolio? – Wall St. Cheat Sheet
With shares of Facebook (NASDAQ:FB) trading around $62, is FB an OUTPERFORM, WAIT AND SEE, or STAY AWAY? Let’s analyze the stock with the relevant sections of our CHEAT SHEET investing framework:
T = Trends for a Stock’s Movement
Facebook is engaged in building social products in order to create utility for users, developers, and advertisers. People use Facebook to stay connected with their friends and family, to discover what is going on in the world around them, and to share and express what matters to them with the people they care about. Developers can use the Facebook platform to build applications and websites that integrate with Facebook to reach its global network of users, building personalized and social products. Advertisers can engage with more than 900 million monthly active users on Facebook — or subsets of its users — based on information they have chosen to share.
Save Time Make Money! A new stock idea each week for less than the cost of a trade. CLICK HERE for your Weekly Stock Cheat Sheets NOW!
Facebook’s reach is massive, and this is news to no one. But a new report from the Pew Research Center’s Journalism Project, which analyzed the role that social media plays in bringing news to Americans, suggests that as many as 3 in 10 adults get some of their news from Facebook, which is currently the most far-reaching social media website. That said, finding news on Facebook is almost never a proactive experience, the study found. The findings suggest that about 78 percent of adults who got some of their news from the website were on Facebook for other reasons, and most of that news became integrated into their news feed because they “liked” a particularly news organization or specific journalist. A full 22 percent of adults surveyed through the study said they thought Facebook was a good way of keeping up with the news, a fact which leaves one feeling rather uneasy about the state of Americans’ awareness of current affairs, especially considering that the study also found that entertainment news was the largest news category on Facebook, comprising about 73 percent of news stories.
The study also found that while Facebook brings news to about 30 percent of adults in the U.S., in general, perhaps due to the fact that reading about the news isn’t what users are normally on Facebook to do, users who visit a news site through Facebook aren’t as engaged in the article as those who come to that same site directly. The study found that a users who arrive at a site spend an average of 1 minute, 42 seconds on that article, while users who arrived at the site directly engaged almost five times as long, averaging 4 minutes, 36 seconds on the article.
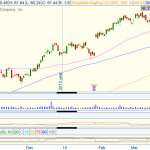
T = Technicals on the Stock Chart Are Mixed
Facebook stock has been exploding to the upside in recent years. However, the stock is currently trading sideways and may need time to consolidate. Analyzing the price trend and its strength can be done using key simple moving averages. What are the key moving averages? The 50-day (pink), 100-day (blue), and 200-day (yellow) simple moving averages. As seen in the daily price chart below, Facebook is trading between its rising key averages which signal neutral price action in the near-term.
(Source: Thinkorswim)
Taking a look at the implied volatility (red) and implied volatility skew levels of Facebook options may help determine if investors are bullish, neutral, or bearish.
Save Time Make Money! A new stock idea each week for less than the cost of a trade. CLICK HERE for your Weekly Stock Cheat Sheets NOW!
Implied Volatility (IV)
30-Day IV Percentile
90-Day IV Percentile
Facebook options
51.60%
90%
88%
What does this mean? This means that investors or traders are buying a very significant amount of call and put options contracts, as compared to the last 30 and 90 trading days.
Put IV Skew
Call IV Skew
April Options
Average
Average
May Options
Average
Average
As of today, there is an average demand from call and put buyers or sellers, all neutral over the next two months. To summarize, investors are buying a very significant amount of call and put option contracts and are leaning neutral over the next two months.
On the next page, let’s take a look at the earnings and revenue growth rates and the conclusion.
E = Earnings Are Increasing Quarter-Over-Quarter
Rising stock prices are often strongly correlated with rising earnings and revenue growth rates. Also, the last four quarterly earnings announcement reactions help gauge investor sentiment on Facebook’s stock. What do the last four quarterly earnings and revenue growth (Y-O-Y) figures for Facebook look like and more importantly, how did the markets like these numbers?
2013 Q4
2013 Q3
2013 Q2
2013 Q1
Earnings Growth (Y-O-Y)
1,322.38%
108.33%
58.33%
0.00%
Revenue Growth (Y-O-Y)
5.65%
59.75%
53.13%
37.81%
Earnings Reaction
14.10%
2.44%
29.61%
5.61%
Facebook has seen increasing earnings and revenue figures over the last four quarters. From these numbers, the markets have been pleased with Facebook’s recent earnings announcements.
Save Time Make Money! A new stock idea each week for less than the cost of a trade. CLICK HERE for your Weekly Stock Cheat Sheets NOW!
P = Excellent Relative Performance Versus Peers and Sector
How has Facebook stock done relative to its peers, Microsoft (NASDAQ:MSFT), Google (NASDAQ:GOOG), LinkedIn (NASDAQ:LNKD), and sector?
Microsoft
Sector
Year-to-Date Return
13.95%
10.38%
1.13%
-14.60%
3.71%
Facebook has been a relative performance leader, year-to-date.
Conclusion
Facebook looks to provide a valuable social networking experience to its users, developers, and advertisers. A new report from the Pew Research Center’s Journalism Project, which analyzed the role that social media plays in bringing news to Americans, suggests that as many as 3 in 10 adults get some of their news from Facebook. The stock has been exploding to the upside, but is currently trading sideways. Over the last four quarters, earnings and revenues have been increasing, which has left investors pleased. Relative to its peers and sector, Facebook has been a relative year-to-date performance leader. Look for Facebook to continue to OUTPERFORM.
Using a solid investing framework such as this can help improve your stock-picking skills. Don’t waste another minute — click here and get our CHEAT SHEET stock picks now.
More From Wall St. Cheat Sheet:
Facebook Is Top Dog in Social Commerce
Eat24 Breaks Up With Facebook
French Privacy Watchdog Takes a Bite Out of Facebook, Google
View article:
Is Facebook a Healthy Stock for Your Portfolio? – Wall St. Cheat Sheet

